Exinda Network Orchestrator
3 Using
|
231
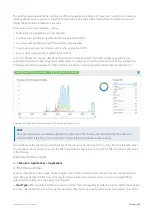
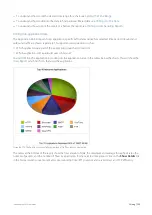
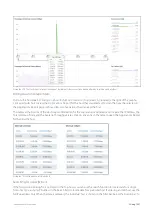
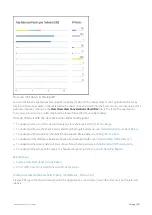
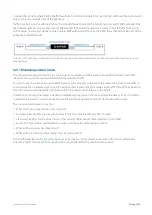
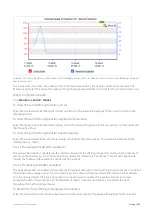
Screenshot 96: The Hosts report displays throughput by internal listeners over time broken down by top listeners and talkers.
Drilling down into report data
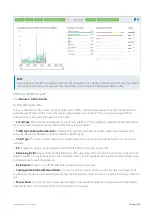
Drill into the host data by clicking on a host in the Top Listeners or Top Talkers list (located to the right of the graphs).
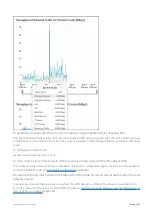
Click a particular host to view the
for the host that you selected. You can then use the selector on
the Applications Report page to show URLs or conversations that involved the host.
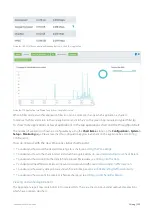
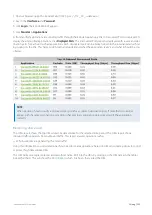
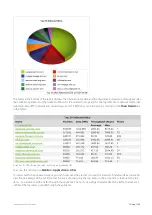
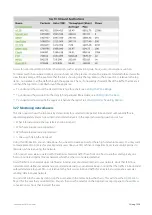
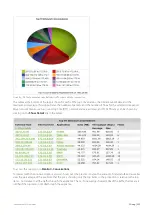
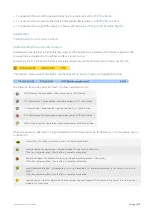
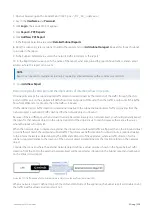
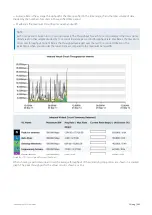
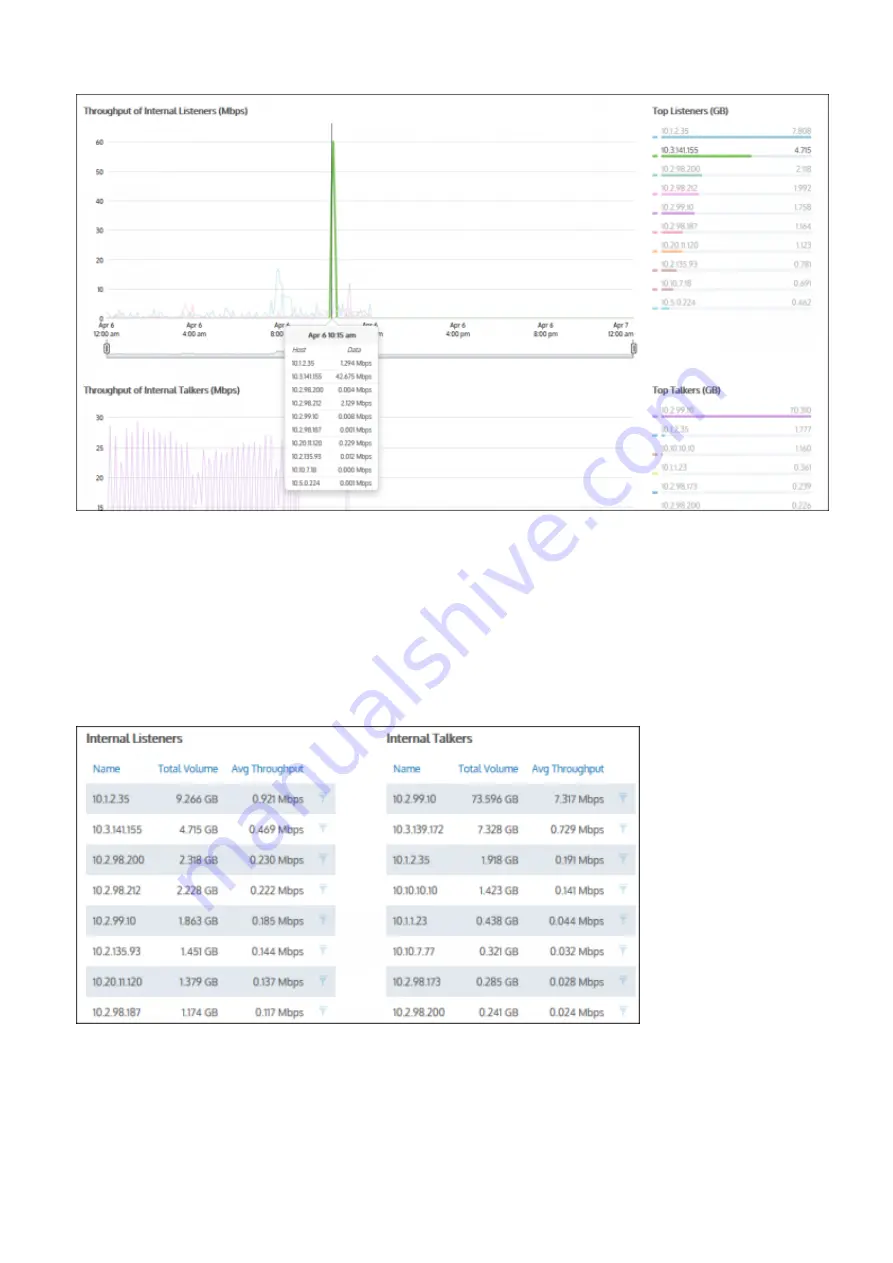
The tables at the bottom of the Hosts report information for the top listeners and talkers and include the IP Address, the
Total Volume of data, and the Average Throughput rates. Click on any entry in the table to open the Applications Report
for that specific host.
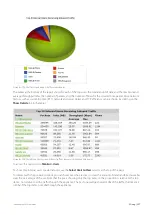
Screenshot 97: Drilling down into hosts data.
Searching for a specific host
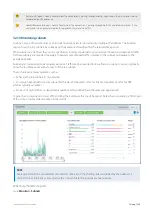
If the host you are looking for is not listed in the Top hosts, you can use the search function to locate data for a single
host only. Type a single IP Address in the Search field to locate data for a particular host. If entering an IPv6 host, use the
full IPv6 address only. When the data is retrieved, the individual host is shown on the filter bar below the button bar. To
Summary of Contents for EXNV-10063
Page 369: ...Exinda Network Orchestrator 4 Settings 369 ...
Page 411: ...Exinda Network Orchestrator 4 Settings 411 Screenshot 168 P2P OverflowVirtualCircuit ...
Page 420: ...Exinda Network Orchestrator 4 Settings 420 Screenshot 175 Students OverflowVirtualCircuit ...


