Exinda Network Orchestrator
3 Using
|
260
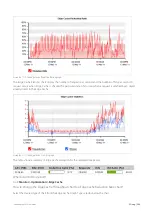
To understand how to set the desired time range for a chart, see
To understand how to print the report or schedule the report, see
Printing and Scheduling Reports
.
Monitoring Exinda Appliance RAM usage
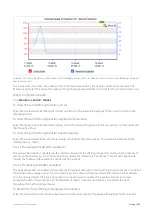
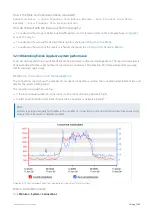
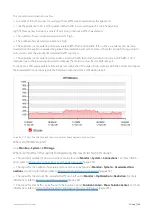
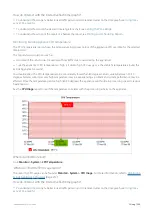
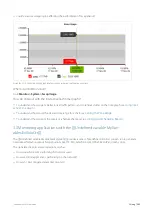
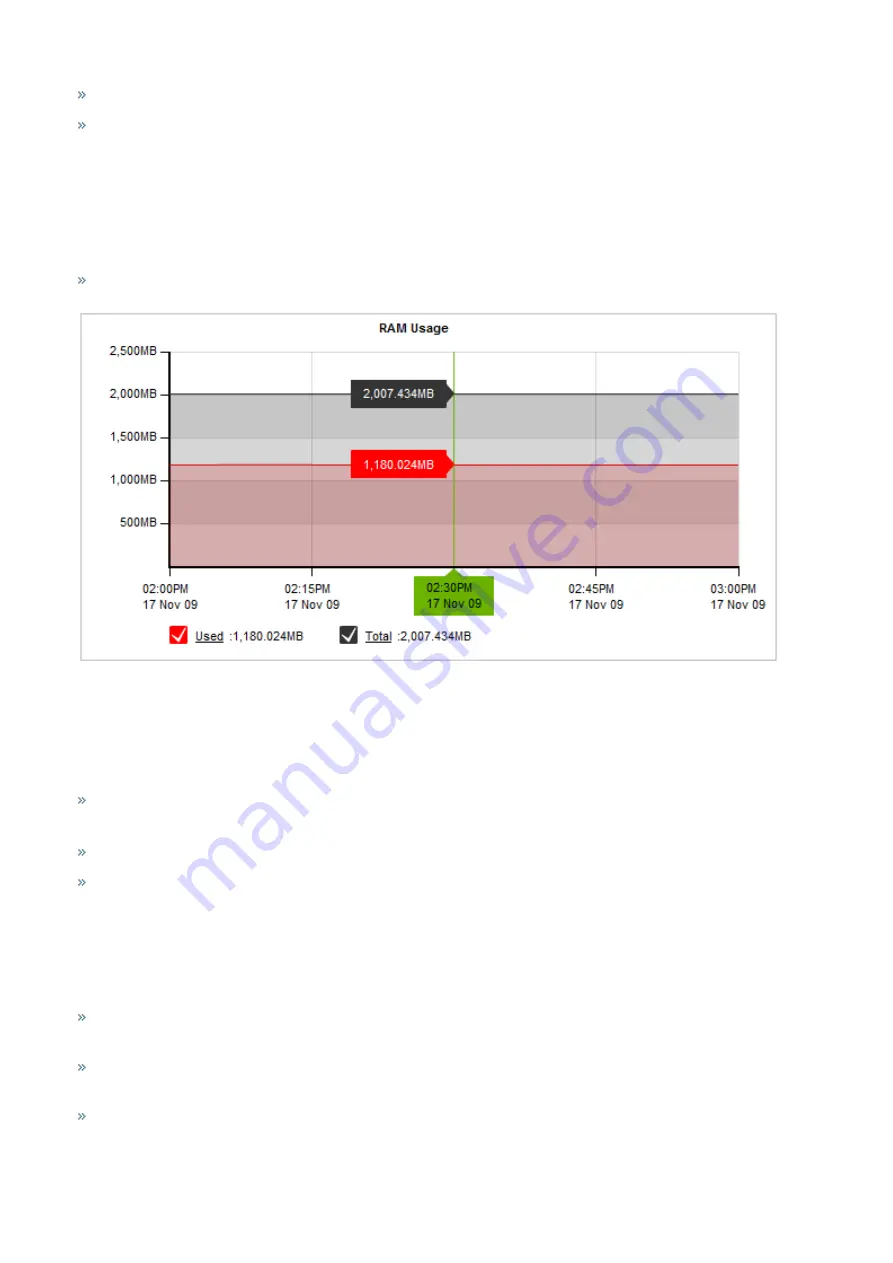
The RAM Usage report shows how much memory the appliance is using relative to the amount of memory available for
the selected time period.
This report answers questions such as:
Could the performance of my appliance be affected by insufficient RAM?
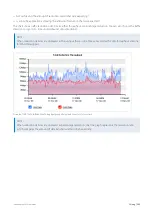
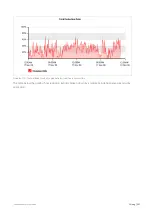
Screenshot 116: The RAM Usage chart displays memory consumption over time.
Where do I find this report?
Go to
Monitor > System > RAM Usage
.
How do I interact with the interactive flash time graphs?
To understand how to get a better look at traffic patterns and to remove clutter on the time graph, see
To understand how to set the desired time range for a chart, see
To understand how to print the report or schedule the report, see
Printing and Scheduling Reports
.
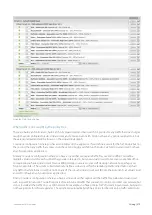
Monitoring Exinda Appliance Disk IO
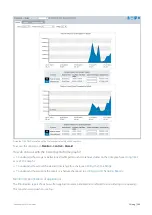
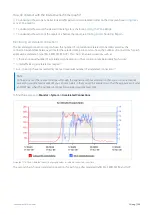
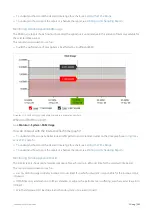
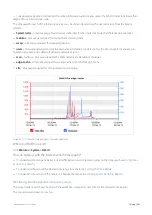
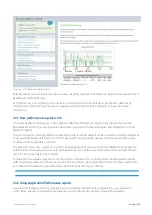
The Disk IO report shows read and write disk usage for each service in kB/s over time for the selected time period.
This report answers questions such as:
Has my disk I/O usage suddenly increased or over time? If so, which subsystem is responsible for the increased disk
I/O usage?
If WAN memory acceleration, or CIFS acceleration, or edge cache performance is suffering, was there a decrease in its
I/O load?
Was that decreased I/O load due to another subsystem's increased I/O load?
Summary of Contents for EXNV-10063
Page 369: ...Exinda Network Orchestrator 4 Settings 369 ...
Page 411: ...Exinda Network Orchestrator 4 Settings 411 Screenshot 168 P2P OverflowVirtualCircuit ...
Page 420: ...Exinda Network Orchestrator 4 Settings 420 Screenshot 175 Students OverflowVirtualCircuit ...

