Exinda Network Orchestrator
3 Using
|
262
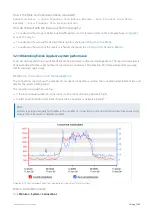
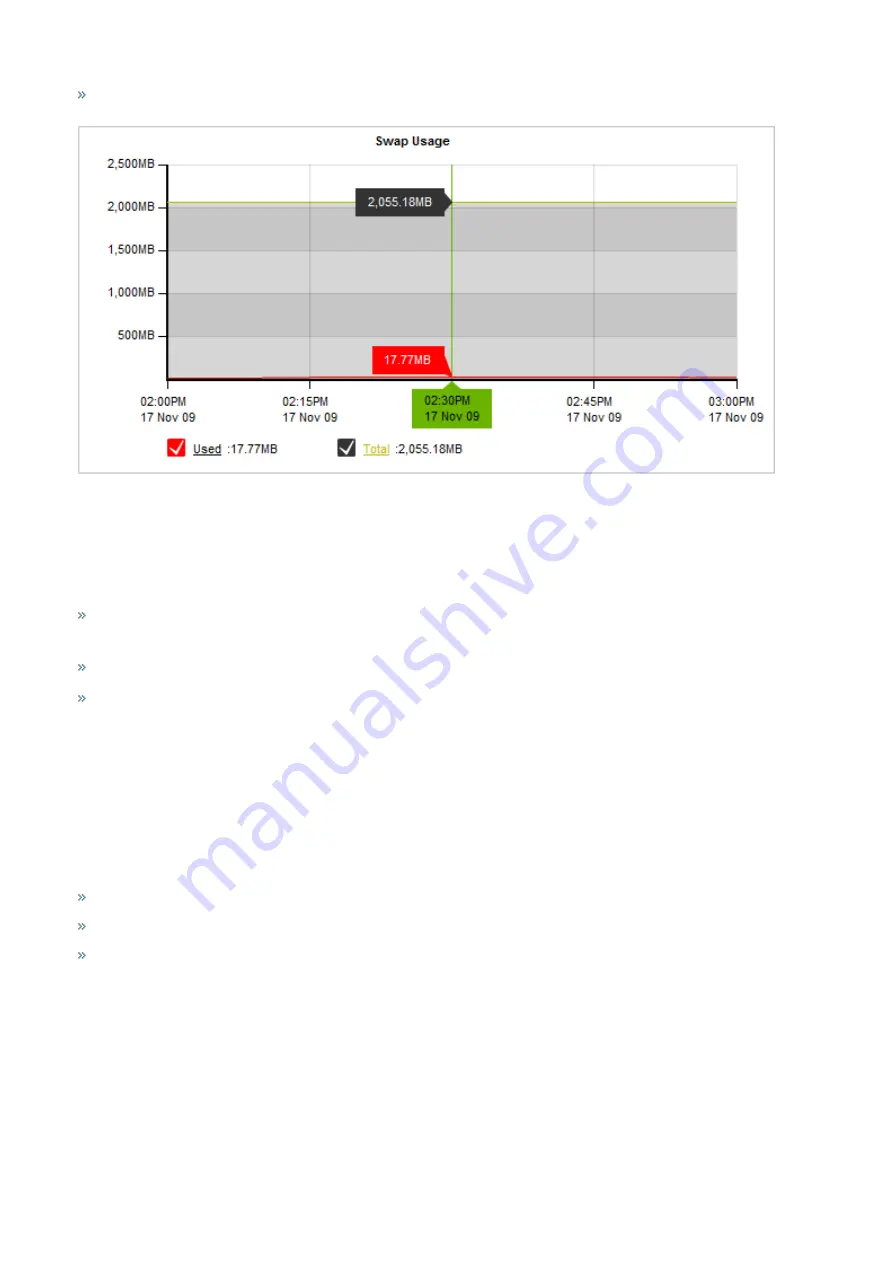
Could excessive swapping be affecting the performance of my appliance?
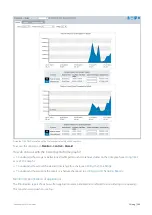
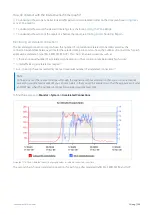
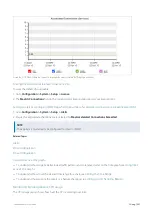
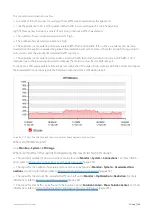
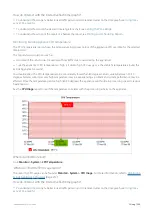
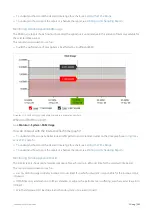
Screenshot 118: The Swap Usage graph displays system swap space utilization over time.
Where do I find this report?
Go to
Monitor > System > Swap Usage
.
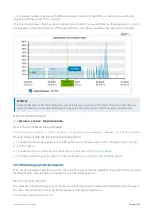
How do I interact with the interactive flash time graphs?
To understand how to get a better look at traffic patterns and to remove clutter on the time graph, see
To understand how to set the desired time range for a chart, see
To understand how to print the report or schedule the report, see
Printing and Scheduling Reports
.
3.3 Monitoring applications with the [[[Undefined variable MyVari-
ables.ExSoluCtr]]]
The [[[Undefined variable MyVariables.ExSoluCtr]]] provides a series of predefined monitors you can run to generate
network performance reports for applications like FTP, SSH, Salesforce.com, Office365 VoIP and many more.
The generated reports answer questions, such as:
How is salesforce.com performing for network users?
How are critical applications performing on the network?
How can I best mitigate data center disasters?
Summary of Contents for EXNV-10063
Page 369: ...Exinda Network Orchestrator 4 Settings 369 ...
Page 411: ...Exinda Network Orchestrator 4 Settings 411 Screenshot 168 P2P OverflowVirtualCircuit ...
Page 420: ...Exinda Network Orchestrator 4 Settings 420 Screenshot 175 Students OverflowVirtualCircuit ...

