Exinda Network Orchestrator
3 Using
|
226
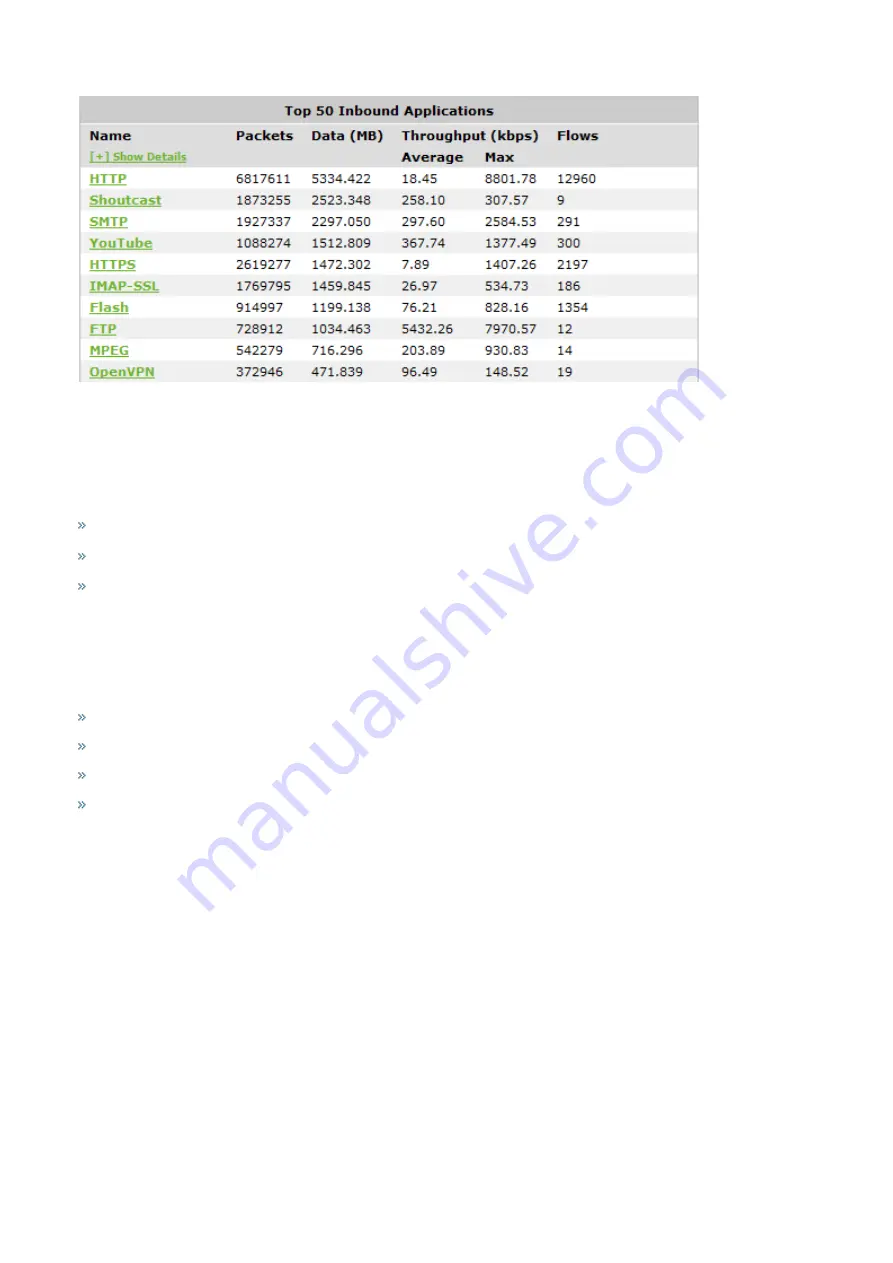
Access this report by drilling in from other reports, such as application group, hosts, users, conversations, subnets.
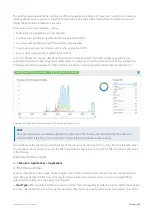
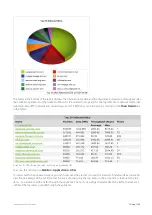
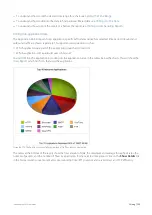
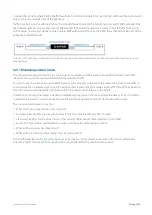
To interact with the pie-based reports, you can hover over the pie slices to view the amount of data transferred as well as
view the percentage of the pie. Note that the pie is showing only the top items, so the proportion is relative to the top
items - not relative to all the traffic through the appliance. That is, if one wedge showed 50% of the traffic, that means it
is 50% of the top items, not 50% through the appliance.
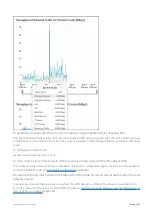
To understand how to set the desired time range for a chart, see
To understand how to drill into the data to find particular filtered data, see
To understand how to print the report or schedule the report, see
Printing and Scheduling Reports
.
3.2.7 Monitoring network users
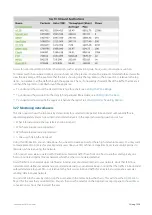
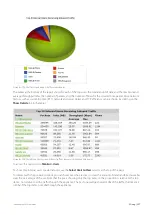
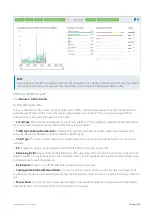
The Users report shows the top users by data volume for a selected time period. Inbound and outbound traffic are
reported separately. You can view internal and external users in the report, answering questions such as:
What internal users are the top talkers and top listeners?
Which external users are top talkers?
Which external users are top listeners?
Is one user choking the network?
Using this information, you can determine if you need to create policies for these high data volume users. You may want
to create protection policies for your important users, like your CEO or finance department, or create control policies to
limit users who are abusing the network.
In this report, users are associated with IP addresses. Network traffic flows from one host to another and typically, one
host is considered internal to your network while the other is considered external.
Hosts that fall into a network object defined as internal are considered internal to your network. Hosts that fall into a
network object defined as external are considered external to your network. Keep in mind that the traffic is inbound and
outbound relative to your LAN – not relative to the host or user. Inbound traffic for an external user means a user was
sending data into your network.
You can drill into the user by clicking on the user name in the tables below the charts. This will show the
for the user that you drilled into. You can then use the selector on the Applications report page to show URLs or
conversations or hosts that involved the user.
Summary of Contents for EXNV-10063
Page 369: ...Exinda Network Orchestrator 4 Settings 369 ...
Page 411: ...Exinda Network Orchestrator 4 Settings 411 Screenshot 168 P2P OverflowVirtualCircuit ...
Page 420: ...Exinda Network Orchestrator 4 Settings 420 Screenshot 175 Students OverflowVirtualCircuit ...


