Exinda Network Orchestrator
3 Using
|
249
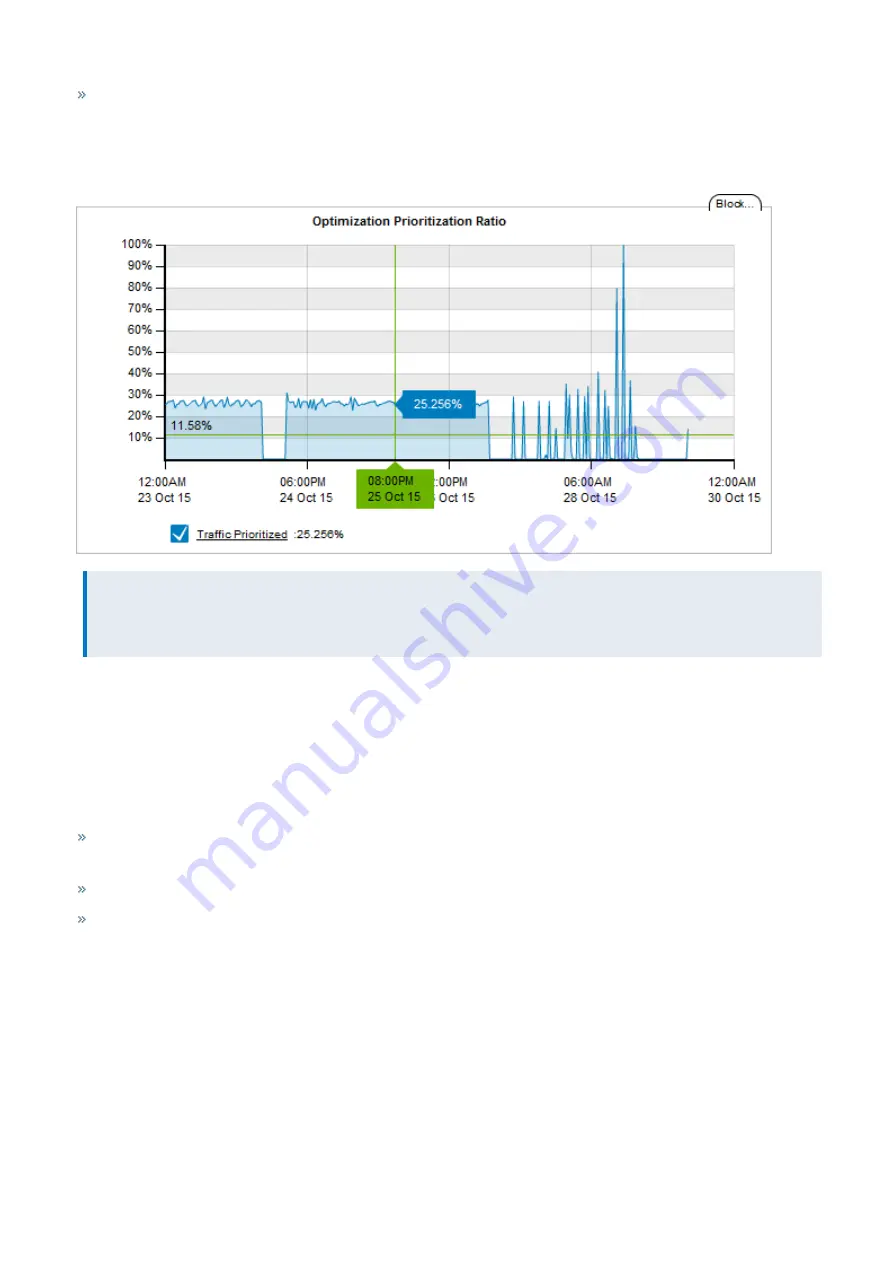
I've created a number of policies with different priorities; how much of my traffic is re-ordered to ensure that my
important traffic has priority on my network?
A high percentage means that the system is prioritizing more often to ensure performance of your applications. A high
percentage also means that by turning off the optimizer there is a higher probability critical applications will suffer.
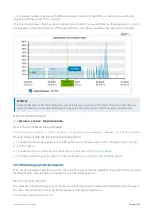
EXAMPLE
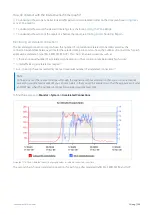
A ratio of 40% means 40% of the packets on your network were re-ordered. That means that non critical data was
queued so business critical data could jump the queue and be delivered according to business requirements.
Where do I find this report?
Go to
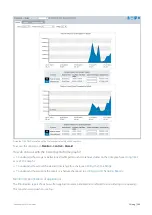
Monitor > Control > Prioritization Ratio
.
How is the prioritization ratio calculated?
Prioritization Ratio = 100 x Number of Packets Re-ordered / Number of Total Packets
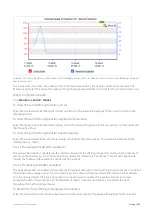
How do I interact with the interactive flash time graphs?
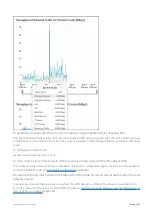
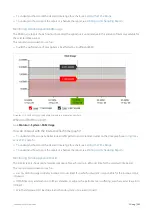
To understand how to get a better look at traffic patterns and to remove clutter on the time graph, see
To understand how to set the desired time range for a chart, see
To understand how to print the report or schedule the report, see
Printing and Scheduling Reports
.
3.2.13 Monitoring optimization reports
Learn about the available optimization reports. These reports let you see the bandwidth savings achieved through using
the WAN memory and Edge Cache configurations on your Exinda Appliances.
Monitoring traffic reduction
The Optimization Reduction report shows the amount of traffic reduction achieved due to WAN memory techniques. It
also shows the amount of reduction per Exinda Appliance peer and per application.
This report answers questions such as:
Summary of Contents for EXNV-10063
Page 369: ...Exinda Network Orchestrator 4 Settings 369 ...
Page 411: ...Exinda Network Orchestrator 4 Settings 411 Screenshot 168 P2P OverflowVirtualCircuit ...
Page 420: ...Exinda Network Orchestrator 4 Settings 420 Screenshot 175 Students OverflowVirtualCircuit ...

