Exinda Network Orchestrator
4 Settings
|
446
Field
Type
Description
rtt
unsigned 32-bit
integer
Round Trip Time in milliseconds. A measure if the time a packet takes to leave a device, cross a
network and return.1
network_
delay
unsigned 32-bit
integer
A normalized measure of the time taken for transaction data to traverse the network.1
network_
jitter
unsigned 32-bit
integer
A normalized measure of the network_delay variability.1
server_
delay
unsigned 32-bit
integer
A normalized measure of the time taken for a server to respond to a transaction request.1
bytes_
lost_in
unsigned 64-bit
integer
The number of bytes lost due to retransmissions (WAN -> LAN).1
bytes_
lost_out
unsigned 64-bit
integer
The number of bytes lost due to retransmissions (LAN -> WAN).1
For more information, refer to
Using Application Performance reports
4.2.5 Monitoring Configuration
You can configure details relevant to monitoring charts and the monitoring data that is collected. You can configure how
the data is displayed, how the traffic is analyzed for monitoring purposes, which order of resolution methods are tried
when resolving IP addresses to hostnames, whether data is collected, and whether collected data is deleted.
For configuring how data is to display, you can specify how many items are shown in the data tables, how many items
are shown in the pie charts, and how many characters to show in the URLs.
For analyzing traffic, you can specify whether to recognize traffic according to layer 7 or layer 3 definitions, and how
sensitive (or aggressive) to be when attempting to recognize BitTorrent, eDonkey, Skype, and flow detection.
For analyzing traffic for specific application types (Application Specific Analysis Modules (ASAM)), you can specify
whether to extract data from Citrix, http, and SSL traffic, whether to identify anonymous proxies in the traffic, whether to
analyze VoIP traffic, whether to calculate the performance and health of connections, whether to collect connection
symmetry information, and whether to log every URL seen in the traffic.
For resolving IP addresses to hostnames, you can specify which methods are tried first, second and so on: network object,
DSN, NetBios name lookup, and IP address.
For collection of monitoring data, you can specify whether to collect data for subnets and virtual circuits, and whether to
collect detailed records for applications, hosts, URLs, users, conversations and subnets, and whether to collect data for
traffic between internal network objects.
For deleting monitoring data, you can selectively delete various types of data collected by the appliance.
To configure monitoring charts display options
Go to
Configuration > System > Setup > Monitoring
tab -
Monitoring Options
form.
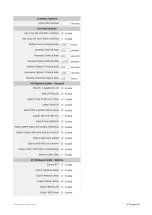
The following fields allow you to modify display options.
Table Items
- Sets the maximum number of top items displayed in the monitoring tables. Acceptable values are 1-
1000.
Chart Items
- Sets the maximum number of top items to displayed in the chart and graphs. Acceptable values are 1-
10. Note that this value will apply universally to ALL options on the Monitor menu.
Maximum URL Size
- Sets the maximum length of URLs displayed on the Real Time report tables.
Graph Display Options
- Specifies whether the graphs display in Flash or non-Flash format. The default is flash.
Summary of Contents for EXNV-10063
Page 369: ...Exinda Network Orchestrator 4 Settings 369 ...
Page 411: ...Exinda Network Orchestrator 4 Settings 411 Screenshot 168 P2P OverflowVirtualCircuit ...
Page 420: ...Exinda Network Orchestrator 4 Settings 420 Screenshot 175 Students OverflowVirtualCircuit ...


