English
27
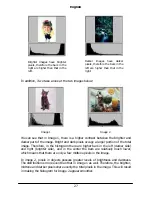
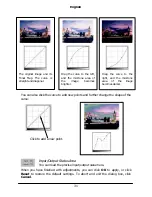
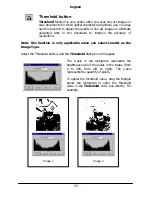
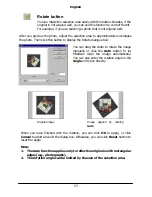
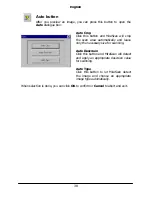
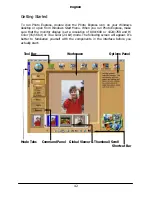
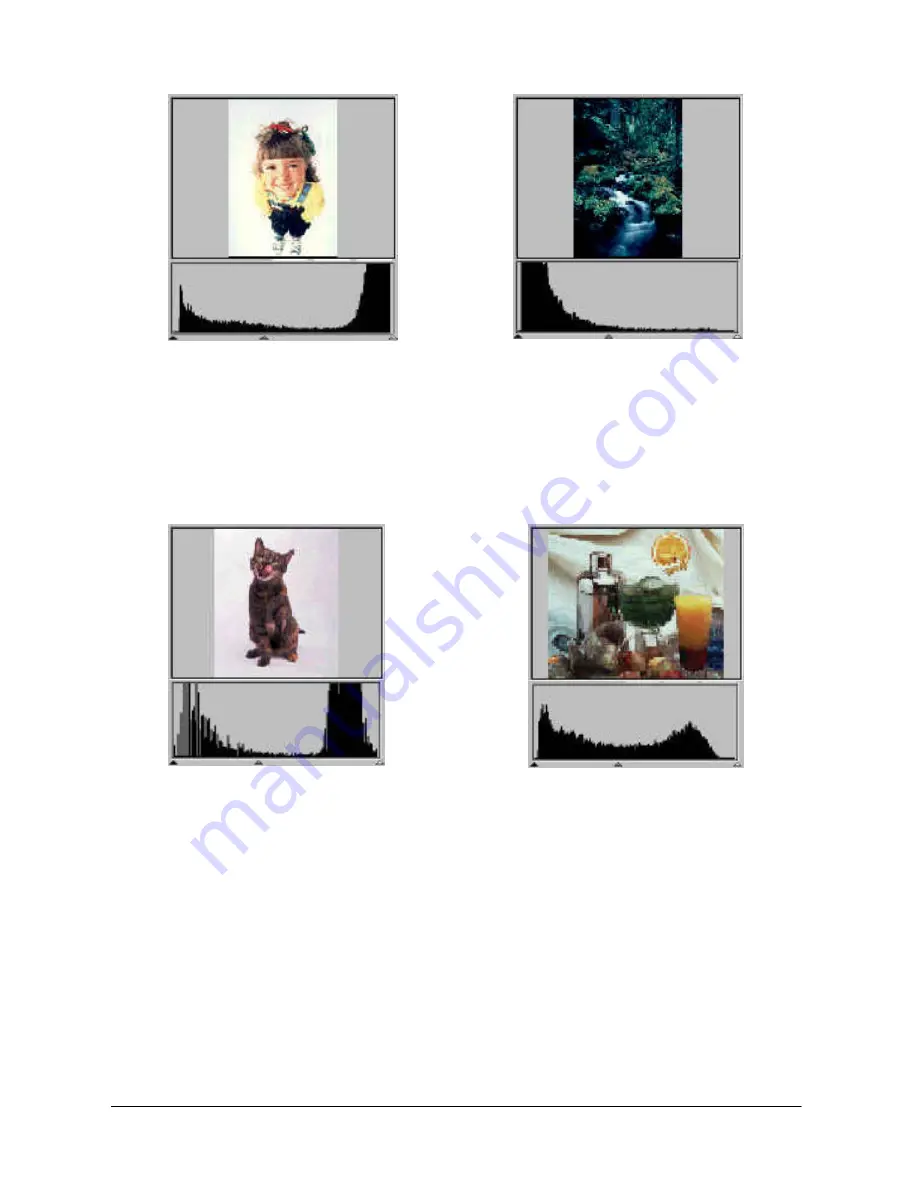
In addition, if we take a look at the two images below:
We can see that in Image 1, there is a higher contrast between the brighter and
darker part of the image. Bright and dark pixels occupy a larger portion of the total
image. Therefore, in the histogram there are higher bars in the left (darker side)
and right (brighter side), and in the center the bars are relatively much lower,
which means that there are only a few midtone pixels in the image.
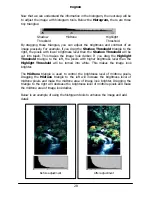
In image 2, pixels in objects possess greater levels of brightness and darkness.
The distribution is more even than that in Image 1 as well. Therefore, the brighter,
midtone and darker pixels share evenly the total pixels in the image. This will result
in making the histogram for Image 2 appear smoother.
Image 1
Image 2
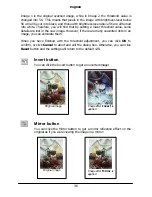
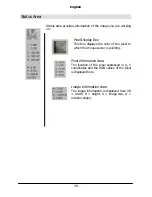
Brighter images have brighter
pixels, therefore the bars in the
right are higher than that in the
left.
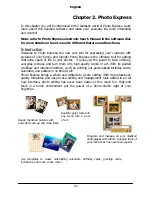
Darker images have darker
pixels, therefore the bars in the
left are higher than that in the
right.
Summary of Contents for Professional Desktop Scanner
Page 1: ...Professional Desktop Scanner User s Manual PC version English...
Page 2: ......
Page 10: ...English iv Memo...
Page 50: ...English 40 Memo...
Page 76: ...English 66 Memo...
Page 80: ...English 70 Memo...
Page 81: ...English 71 Appendix MiraScan main screen guide map...
Page 82: ...English 72 MiraScan main screen guide map continued...

