121
The FIS-Viewer
Tool
Sym-
bol
Description
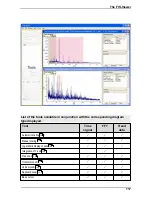
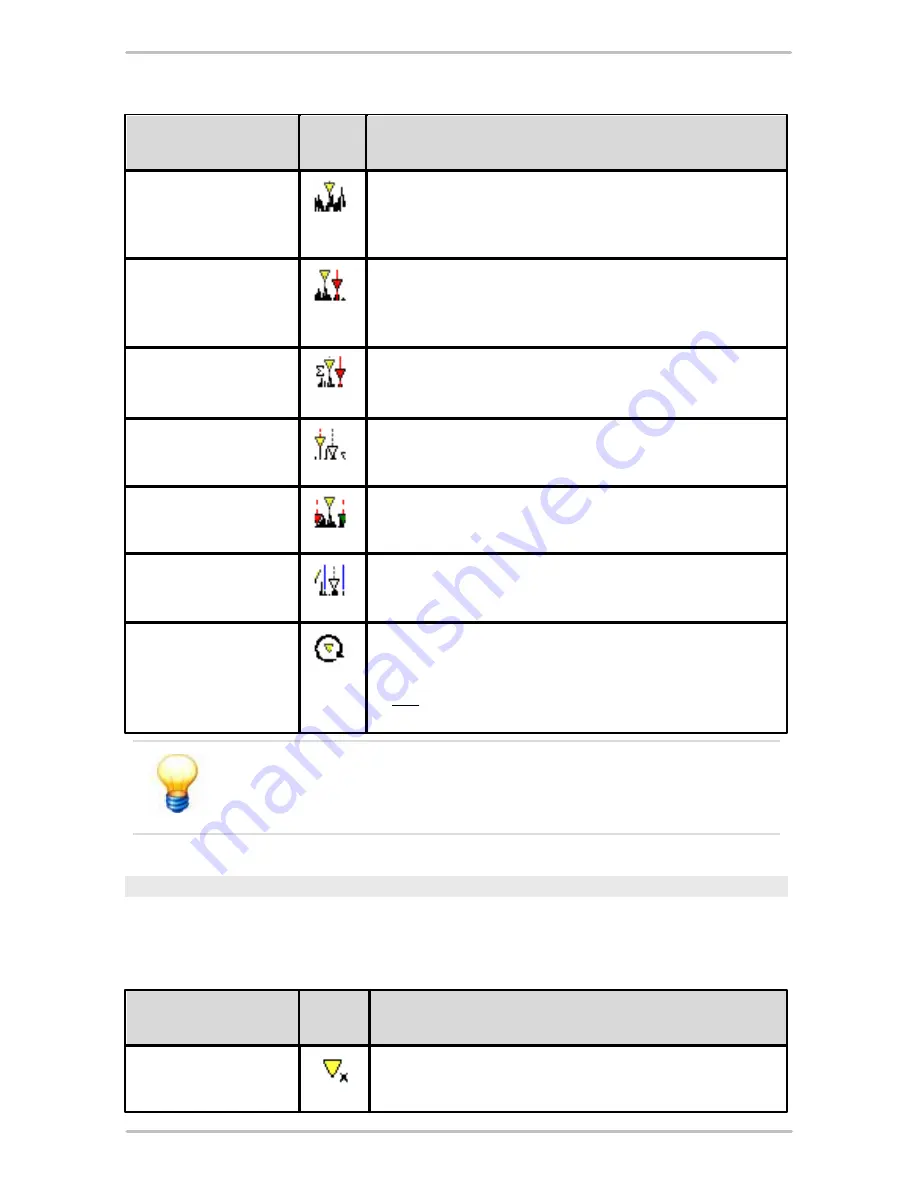
Base cursor
(FFT, Time signals,
Trend data)
You can use the
base cursor
to determine the measured values on
the X and Y axis of a measuring point.
Difference cursor
(FFT, Time signals,
Trend data)
You can use the
difference cursor
to calculate the difference
between two measured values.
RMS/AMV cursor
(FFT, Time signals)
You can calculate the RMS (root mean square/effective value) and
the AMV (arithmetic average) between two measuring points using
the
RMS/AMV cursor
.
Harmonic cursor
(FFT)
You can use the
harmonic cursor
to determine measured values at
points in the diagram where harmonics (multiples of the basic
frequency) are likely to occur.
Sideband cursor
(FFT)
You can use the
sideband cursor
to determine additional measured
values in definable sidebands starting from the base cursor.
HS cursor
(FFT)
The
HS cursor
(Harmonic with Sidebands) combines both cursor
types described above which means that both the harmonics and
their sidebands will be displayed.
Revolutions cursor
(FFT, Time signals
The
revolutions cursor
marks the frequency that is assigned to a
specific speed with a line. The value for this speed is calculated as
follows:
[ ]
Hz
f
U
n
×
=
úû
ù
êë
é
60
min
A cursor can only be placed at a measuring point that exists. If you
click on a position in the diagram where no measured value exists the
cursor automatically jumps to the nearest existing measuring point.
Additional tools
In addition to the zoom and cursor tools you can use a range of further tools to
change the manner in which signals or cursors are displayed and transfer data to
other programs via the clipboard.
Tool
Sym-
bol
Description
Positioning of base
cursor
Places the base cursor at a point in the diagram specified via
numeric input. The base cursor jumps to the measuring point nearest


