
122
the value entered.
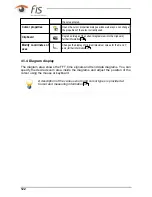
Cursor properties
Opens the cursor properties dialogue window where you can change
the properties of the cursor currently used.
Clipboard
Copies an image of the current diagram view into the clipboard (
further information
).
Modify coordinates of
axes
Changes the display of minimum/maximum values for the X and Y
axis (further information
).
4.1.4 Diagram display
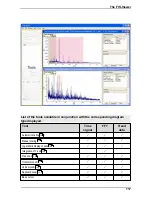
The diagram area shows the FFT, time signals and trend data diagrams. You can
specify the desired zoom area inside the diagrams and adjust the position of the
cursor using the mouse or keyboard.
A description of the various zoom and cursor types is provided at
Cursor and measuring information
.
151
151
123










![Lambrecht Ser[LOG] Operator'S Manual preview](http://thumbs.mh-extra.com/thumbs/lambrecht/ser-log/ser-log_operators-manual_3390951-001.webp)


