174
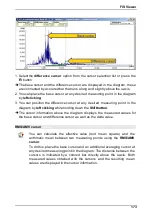
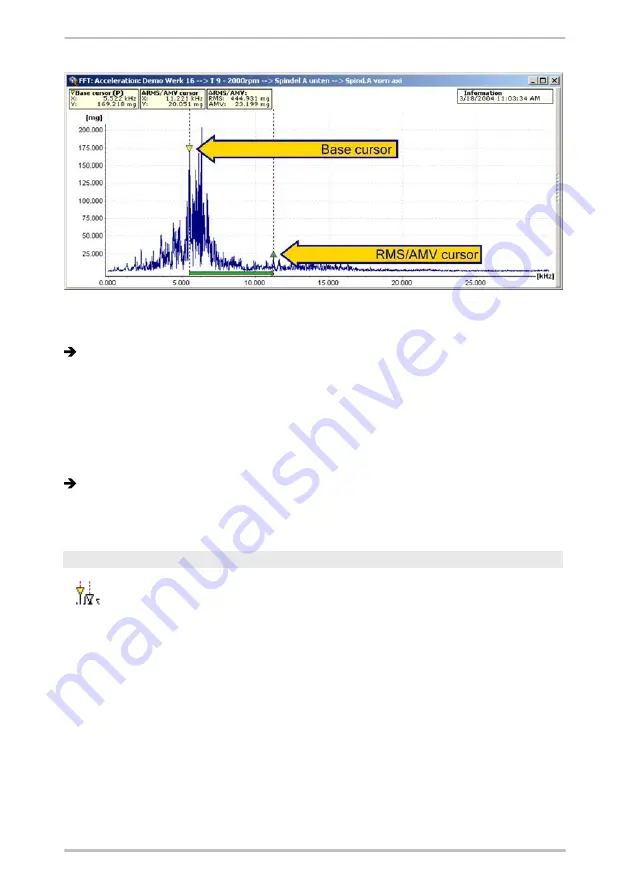
1. Select the
RMS/AMV cursor
option from the cursor selection list or press the
F4
button.
The base cursor and the averaging cursor are displayed in the diagram, these
are connected by a colored bar that runs along the x-axis and slightly above it.
2. You can place the base cursor at any desired measuring point in the diagram
by clicking the left-hand mouse button.
3. You can position the RMS/AMV cursor at any desired measuring point in the
diagram by clicking the left-hand mouse button with the Shift button pressed
down.
The measured values of the base cursor, the averaging cursor as well as the
arithmetic and RMS value for the area specified are displayed in the cursor
information above the diagram
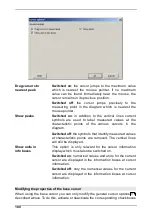
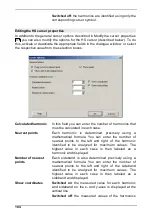
Harmonics cursor
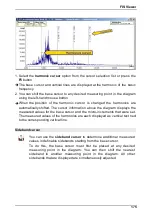
You can use the
harmonics cursor
to determine whether harmonics
are present in the diagram (integer multiple of a vibration).
To do this, place the base cursor at any desired measuring point in the
diagram. The harmonics are displayed in each case as drawn-through
vertical lines. The corresponding measured values are displayed at the
upper end of the vertical lines, and the measured values for the base
cursor are displayed in the cursor information.


