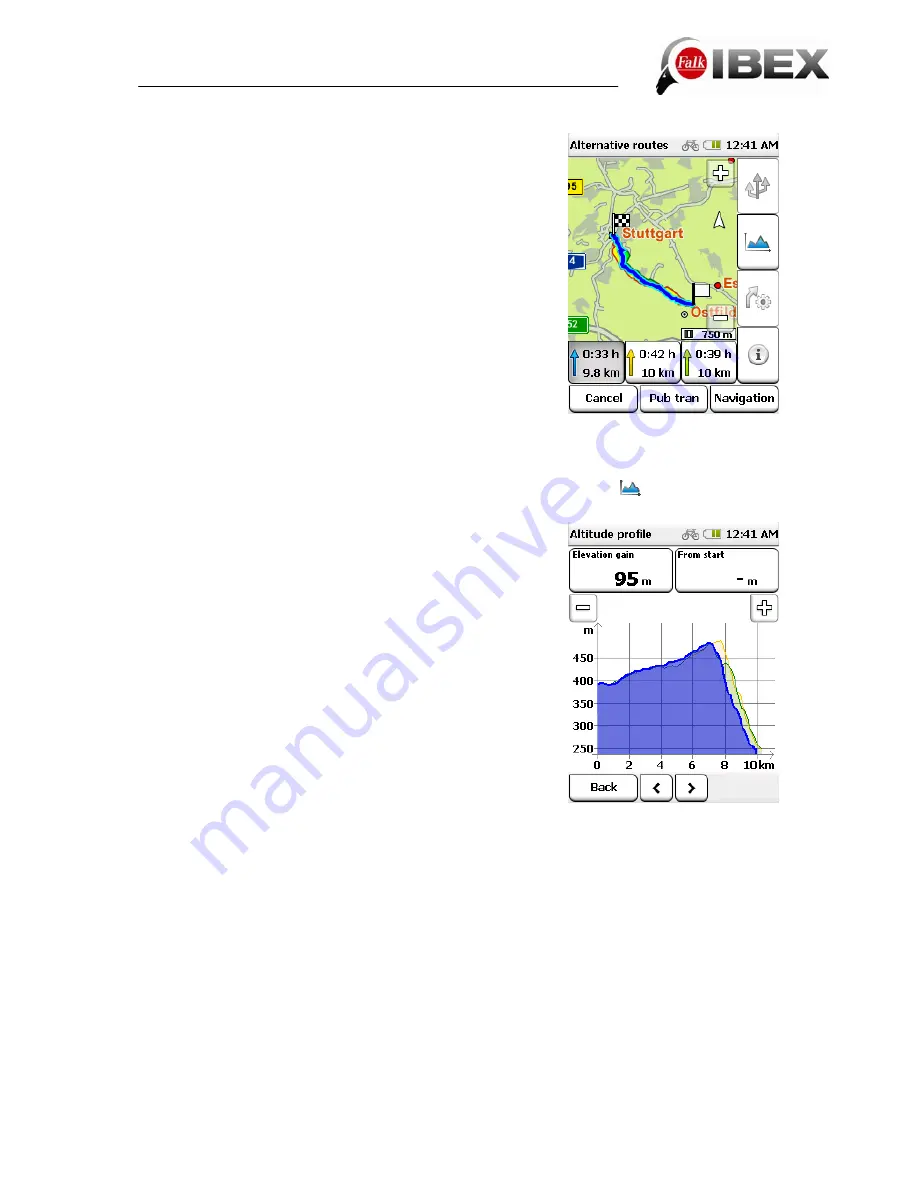
Alternative routes and altitude profiles
If after calculating a route you have calculated alternative
routes, they are shown in different colours on the map.
You can then select an alternative via the boxes at the
bottom which are also marked in the relevant colour.
You can then view the different information for the selected
alternative.
You can compare the altitude profiles for all alternatives if you tap on
.
The altitude profiles are marked in the same colour as the
route in each case.
The route is plotted on the x axis in km (or in miles). On the
y axis the geographical altitude is plotted in m (or in feet).
The scale can be altered using the plus and minus buttons.
You can switch between the altitude profiles using the
arrows at the bottom.
Tip:
Zoom in closer to identify more details in the altitude
profile. If you tap twice on a point on the graph, this point is
zoomed in on.
When you click on a point on the graph, it is marked and the
distance from the starting point is displayed. By clicking on
one of the info boxes, different values which are to be
displayed there can be selected.
Falk IBEX User Manual
21
Summary of Contents for IBEX
Page 1: ...User Manual ...


