Maestro Navigator 3.5.3.doc
88
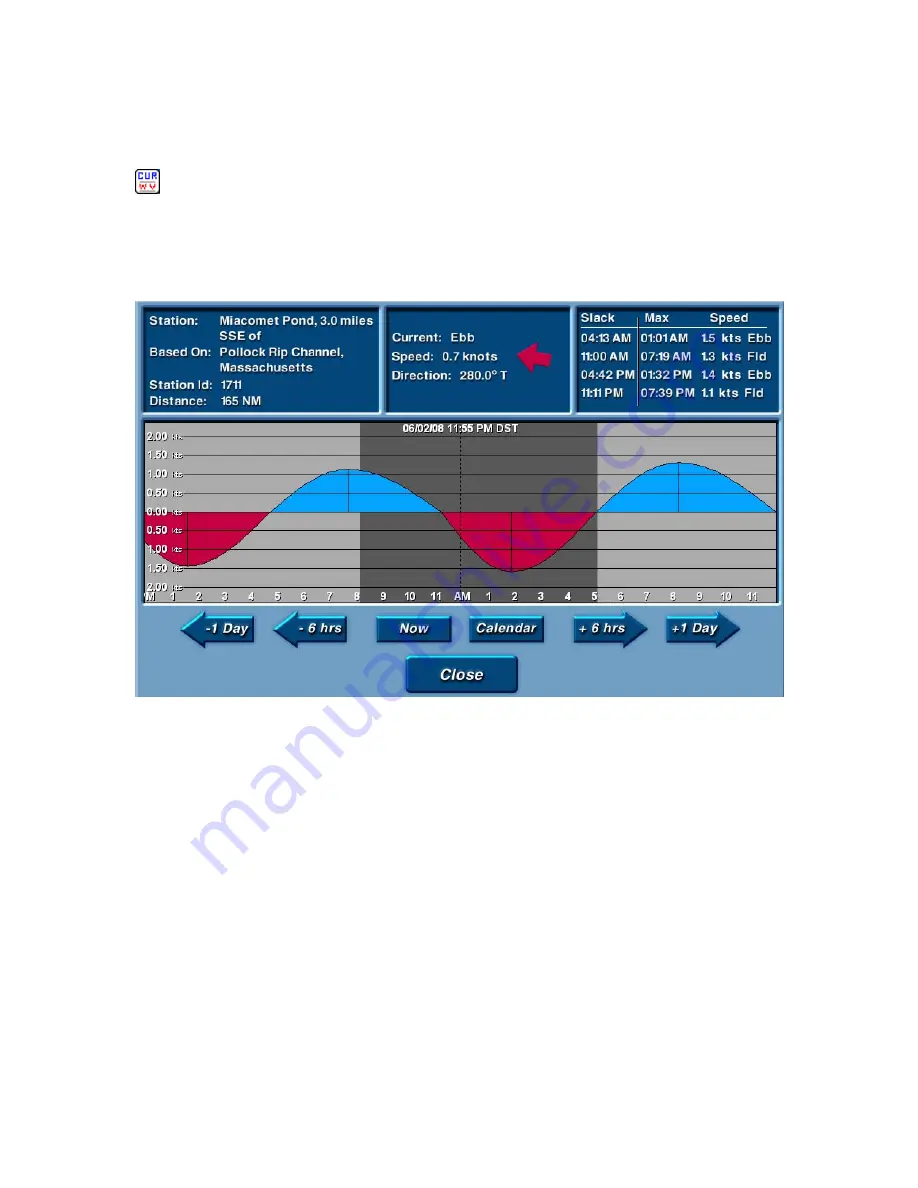
To get more information about a current station, touch the icon and that station’s current
graph is displayed.
Current graphs
provide data on the type, speed, and direction of the
current at each current station.
Click on the icon to open the graph.
Interpreting the Current Graph
Current graphs are very similar to tide graphs. The graphs show fluctuations in the
current’s speed and direction hour by hour.
x
The vertical axis shows the speed of the current.
x
Time progression moves from left to right, and is shown in hourly increments
on a 12-hour scale.
x
The horizontal line through the center of the graph indicates a speed of 0
knots (slack water).
x
Where the line peaks above the center line (blue shading), the current is
flooding.
x
The valleys (red shading) between the peaks show when the current is
ebbing.
Historical Currents
When you first open the Current Graph, it shows the present conditions. All 24 hours for
today’s date are shown, and a vertical dotted line indicates the present time.
For Researching Past and Future Conditions, use the buttons labeled -1 Day, -6 hrs, + 1
Day, + 6 hrs to scroll the graph backward and forward in time. As you change the day or
hour, the graph scrolls to represent conditions at the specified time. The date and time
represented by the dotted vertical line will update as you scroll the graph.
Press the
Calendar
button to select distant dates.
Summary of Contents for Maestro
Page 1: ...User s Manual TM IS0270 rev A ecr 8171 3 2010 ...
Page 2: ......
Page 8: ......
Page 50: ......
Page 68: ......
Page 86: ...Maestro Navigator 3 5 3 doc 82 ...
Page 90: ......
Page 94: ...Maestro Navigator 3 5 3 doc 90 ...
Page 122: ......
Page 140: ......
Page 142: ......


