IL3 User’s Guide
page 60
11S-3002B
Application Notes
Application Note 1: Histograms
Histograms are available on the TS3 to help the user assess the lighting and color balance of the scene
framed by the camera. This App Note is provided to help the TS3 user understand the information
provided by histograms and to offer some basic guidance on their use.
Histograms are available on cameras with Mono and Color sensors. Histograms for Color cameras use
Red, Green, and Blue lines to represent the RGB pixel values, while histograms for Mono cameras use
a single black line to represent all pixel values.
Note: Histograms on the TS3 always shows pixel values 0-255. When the camera is recording in 10-bit
mode, the histogram uses high, med, or low 8-bits, depending on the Display setting.
Mono Histograms:
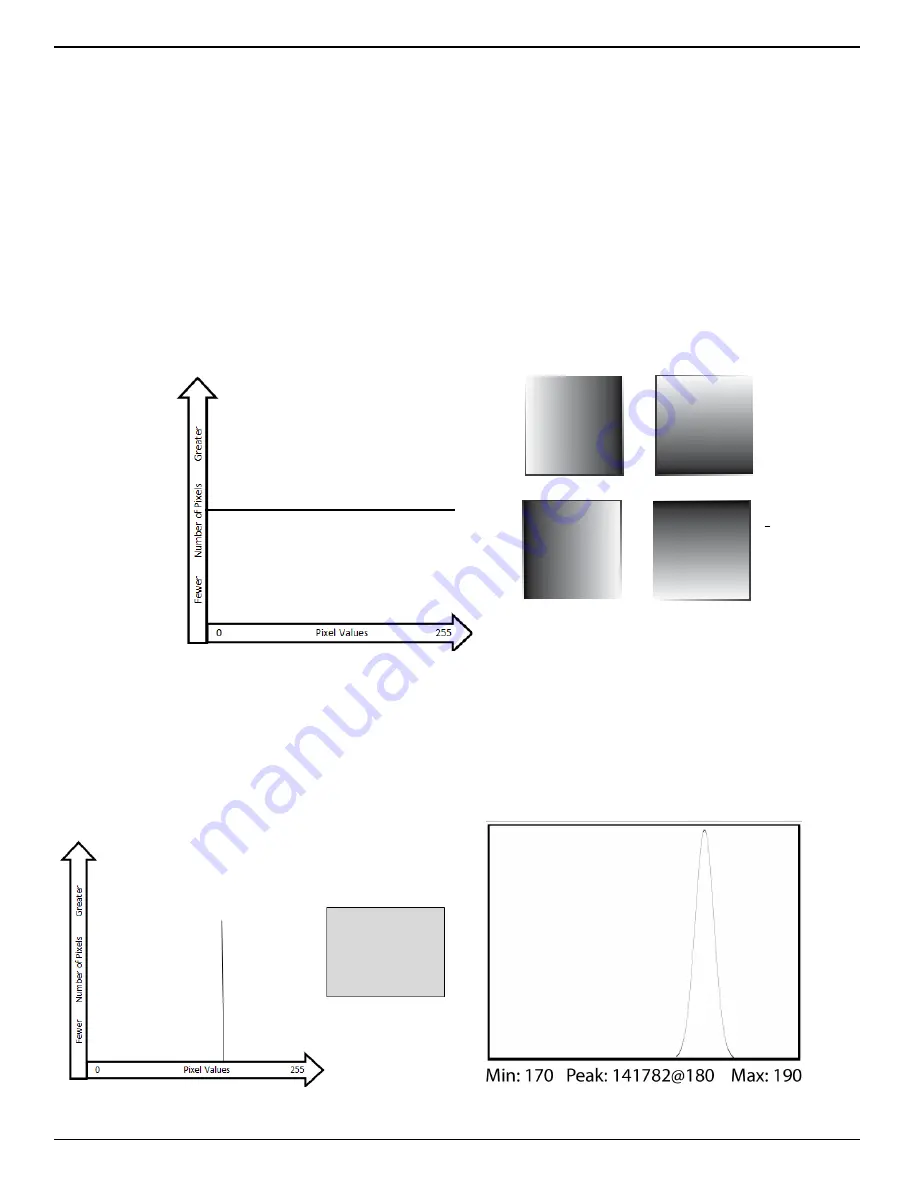
The Mono histogram is a simple single-line graph. The Y-axis (vertical) represents the number
of pixels. The X-axis (horizontal) represents pixel values. The first thing to understand is that the
histogram offers quantitative information only; it includes no spatial information. Looking at a
histogram gives you no idea of the location of bright or dark pixels in the image.
A histogram of a perfect linear gradient, regardless of its orientation would be a straight horizontal
line because there would be exactly the same number of pixels of each value.
The histogram of a perfect mono-tonal image, is a straight vertical line because all of the pixels have
the same value. In practice, because it is unlikely we will be able to image a perfectly flat field, the
Figure 7-1: Histogram: Linear Gradient
Figure 7-2: Histogram: Mono-tonal


