27
ENGLISH
ENGLISH
Unit size
16
19
24
30
38
42
50
MU
NOTES
Graph reference
1
2
3
4
5
6
7
/
Q=
Water flow rate
∆∆
p=
Loss of pressu-
re
Lower limit value
Q
0.13
0.17
0.18
0.21
0.27
0.32
0.36
l\s
∆∆
p
10
kPa
Upper limit value
Q
0.43
0.53
0.59
0.66
0.88
1.03
1.15
l\s
∆∆
p
100
kPa
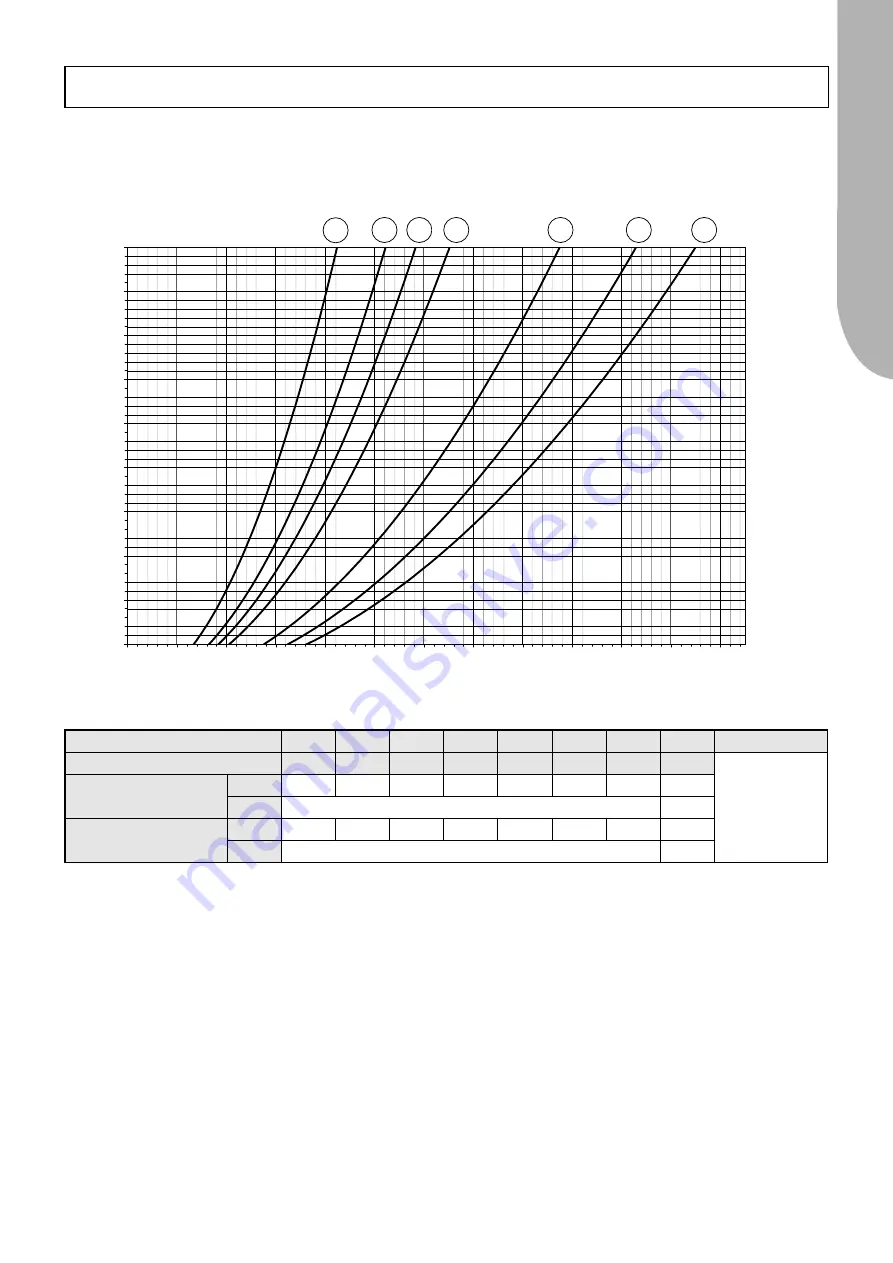
WATER PRESSURE DROPS
The graph below illustrates the water pressure drop values in
kPa
depending on the flow rate in
liters/second
for
units that operate without the Pumping Module accessory.
The operating range is delimited by the minimum and maximum values given in the next table.
W
ater pressure drop (kPa)
Water flow rate (l/s)
10
20
30
40
50
60
70
80
90
100
0,00
0,10
0,20
0,30
0,40
0,50
0,60
0,70
0,80
0,90
1,00
1,10
1,20
1
2
3
4
5
6
7
Limits to operation


