FK-400-000 5 I56-3883-003
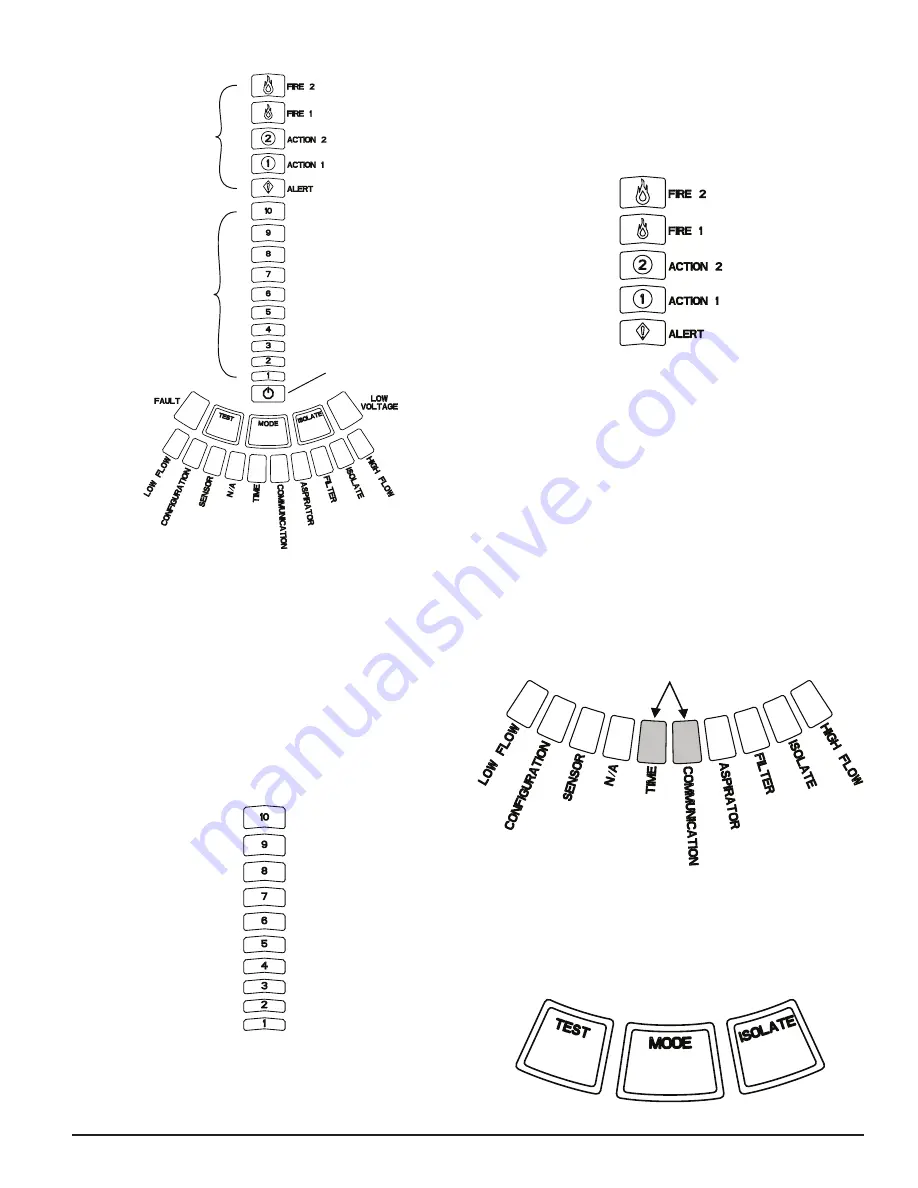
FIGURE 5. PARTICULATE LEVEL DISPLAY
ASP-09
FIGURE 6. ALARM LEVEL DISPLAY
ASP-10
USER INTERFACE CARD INSTALLATION
The user interface card must be installed on the front panel of the FAAST
aspirating smoke detection system. For installation, first slide the card into
the bottom pocket, then beneath each of the mounting tabs. If necessary,
use a flathead screwdriver to gently press the card in place beneath each of
the mounting tabs. The card is moderately flexible to allow for some bending
during installation. The user interface card is available in various languages.
PARTICULATE LEVEL DISPLAY
The particulate level display, shown in Figure 5, consists of ten amber LEDs
that correspond to the current level of the particulate detected. The LEDs il-
luminate in order from Level 1 to Level 10, starting from the bottom of the
display and moving up as the particulate level increases. Each LED represents
a ten percent increase in the particulate level necessary to reach the user pro-
grammable level.
ALARM LEVEL DISPLAY
The Alarm Level Display consists of five red LEDs that correspond to the cur-
rent alarm level, shown in Figure 6. These LEDs are located directly above the
Particulate Level LEDs. They illuminate sequentially upward as the severity of the
alarm increases.
AIR FLOW/FAULT DISPLAY
The FAAST system uses ultrasonic airflow sensing and displays the status in
real time on the User Interface. The air flow/fault display consists of 10-bi-
color LEDs and operates in one of two modes. A default warning occurs when
airflow increases or decreases by 20% or greater. The green segments indicate
how close the current air flow is to either of these thresholds. During normal
operation two adjacent indicators are green and correspond to the current air-
flow entering the detector. When airflow is at a balanced level the two green
segments are centered on the graph at levels 5 and 6, see Figure 7. As air-
flow rises and falls, the green segments move right and left accordingly. The
segment on the far left represents a decrease in airflow of 20%. Conversely,
movement to the segment on the far right represents an airflow increase of
20%. A flow fault occurs within 3 minutes of reaching either of these levels
and the minor fault relay is indicated. During a fault condition, the fault LED
as well as the corresponding high or low fault segment is lit in amber.
Labels
Detector faults are labeled adjacent to the indicators on the Air Flow Fault graph.
FIGURE 8. USER INTERFACE BUTTONS
FIGURE 7. BALANCED AIR FLOW
ASP11-01
USER INTERFACE BUTTONS
The user interface has three buttons, shown in Figure 8, that are used to op-
erate the unit. Functionality of these buttons are locked out by default from
the factory and require a passcode to enable them (refer to Passcode Access
section). The passcode can be programmed from the PipeIQ software tool.
GREEN LEDs
ASP14-01
FIGURE 4. USER INTERFACE DISPLAY
Alarm Level
Indicator
Particulate Level
Indicator
Power
Indicator
ASP08-02
These alarm levels are configured at default levels when shipped. Each of these
alarm levels can control a set of form C relay contacts. When an alarm level thresh-
old is crossed, the corresponding level LED illuminates and the relay activates a
signal. These alarm levels and associated relay outputs can be programmed for
either latching or non-latching operation, in addition to a programmable delay for
each level. The programmable ranges for each level are shown in Table 3.


