32
RS485
This output allow a serial connection to the device. By connecting it to a BMS (Building
Management System), it is possible to extract data regarding device controller functioning
and status.
Please, do contact the manufacturer for the table regarding MODBUS communication
protocol applying.
4-20mA chamber A & chamber B (additional module needed)
This output allows to connect, matching the polarities, to an external acquisition system fitted
with 4-20mA input. By means of the additional module, the controller and DMLP probes value
is converted into a value of electric current and may be monitored by a suitable instrument.
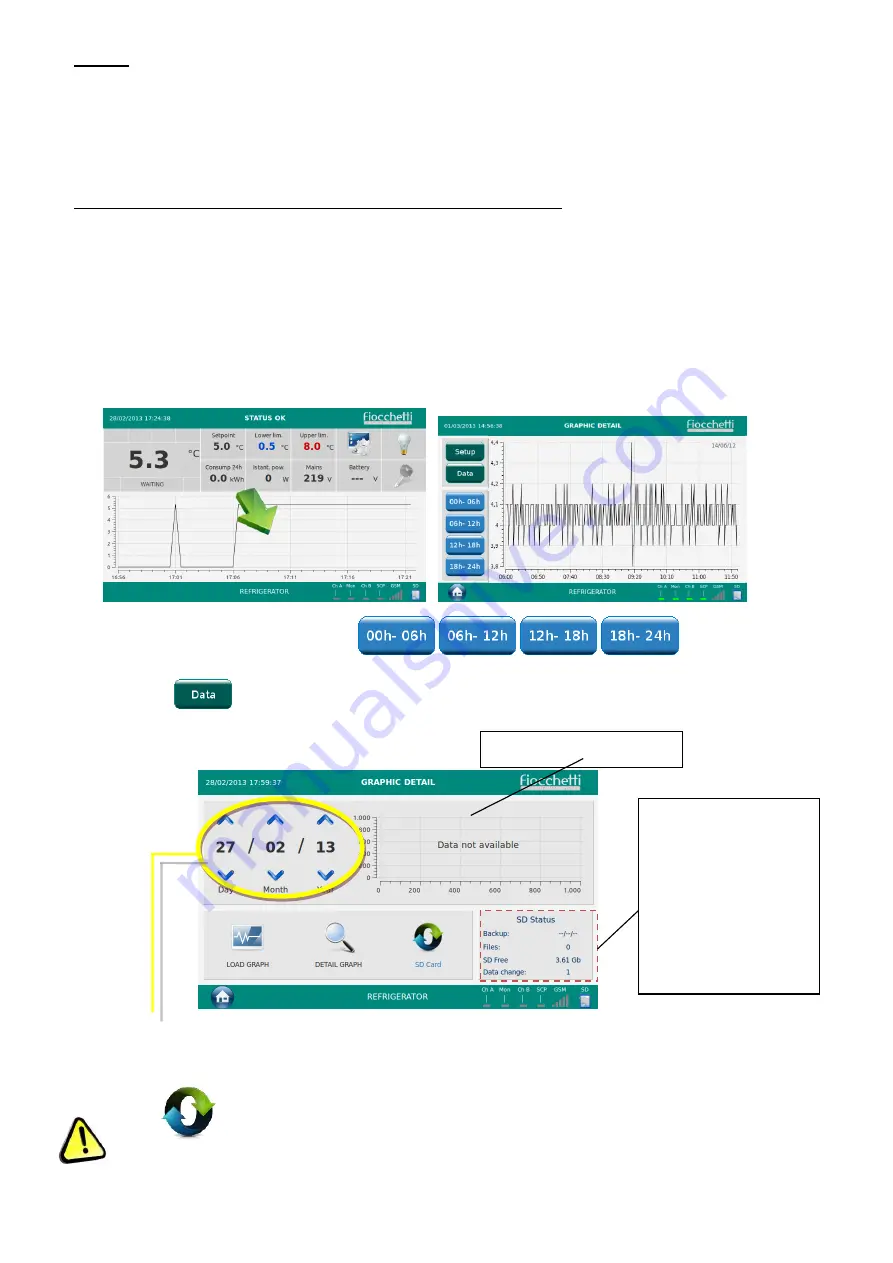
5.2.18 TEMPERATURE GRAPHIC VISUALIZATION
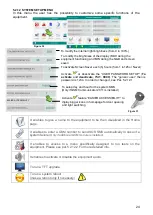
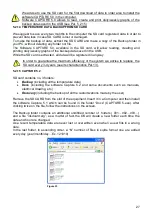
In the Homepage a temperature graph of the last 6 hours is constantly built and visualized.
Touching the graph the user can enter the menu “GRAPHIC DETAIL”.
By means of the following icons
,
,
,
it is possible to
visualize immediately the current daily time spans graphic details.
By touching
it is, on the contrary, possible to analyze the past registered temperature
data.
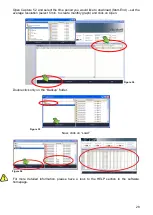
It is sufficient to select the day/month/year that you want to visualize and touch the icon
“LOAD GRAPH” in order to load the daily graph. Touching the icon “DETAIL GRAPH” it is
possible to visualize the time spans graphic detail of the loaded day.
Icon
allows to switch from SD stored data to the flash memory stored data in
case of SD card loss.
SD INFO:
Date of last
Backup.
No files
included.
Free space.
No. of
date/hour
changes done
by the user.
24h graphic preview
Figure 45
Figure 46
Summary of Contents for ECT-F TOUCH
Page 1: ...USER AND MAINTENANCE Manual ECT F TOUCH ...
Page 2: ......
Page 55: ......
Page 56: ...56 MNL066_ENG Rev B ...


