The middle portion of the page shows the approach profile view of the approach path. The three lines
angling to the runway indicate the glideslope path with plus one dot and minus one dot deviations. The
intercept altitudes (both MSL and AGL) are shown just below the plot.
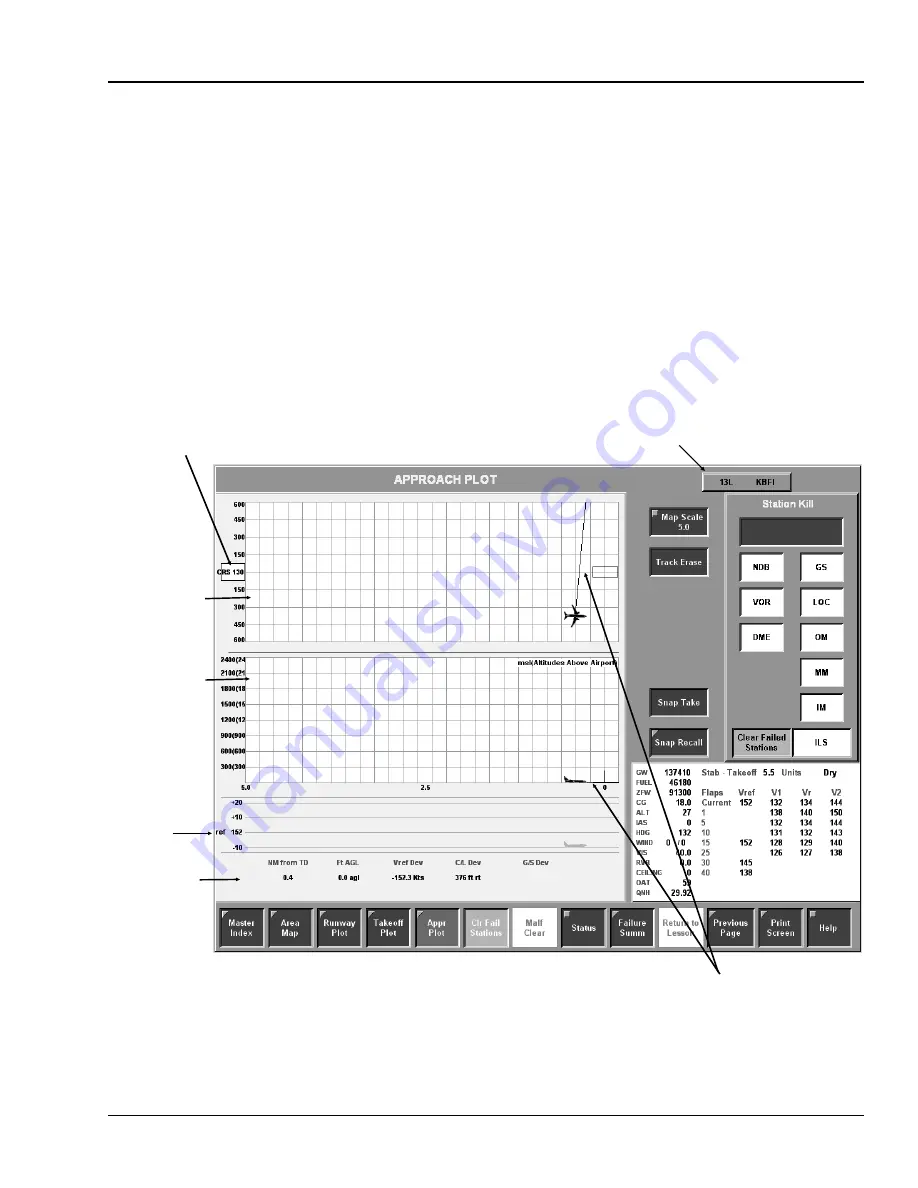
The Non-precision Approach Plot page will appear when the APPR PLOT Map Collar button is selected
and the active runway does not have an ILS approach. See Figure 3-15. This page depicts the aircraft
approach path. The active airport and runway identifiers are displayed in the upper right corner.
The upper portion of the page is the Approach Plan view showing the runway and the aircraft centerline
deviation and distance from the runway. The runway heading is shown on the left side of the page. The
middle portion of the page shows a profile view of the approach path. The lower portion of the page
displays a V
ref
deviation graph. The bottom of the page contains approach data line items of the data that
is displayed on the various graphs.
Runway
Heading
Approach
Plan View
Active Airport
and Runway
Approach
Profile
View
V
ref
Deviation
Plot
Approach
data
Touchdown
Zone
Figure 3-15. Non-precision Approach Plot
TM-3-B 737-IOS1-007
APPROACH PLOT
FSI-SSD
3-18
TOUCH SCREEN (NT IOS)
B 737
JAN 2001


