FT-112(D) Panel Weighing Indicator, Technical Manual, Rev.1.0.0, May 2019
Page
37
of
170
Date and Time
RELATED PARAMETERS: Parameters 251, 252 and 253.
Date format of the country
1. Enter the programming and go to parameter 251,
page 56
2. Press
or
keys to select date format: DMY ( DD.MM.YYYY ), MDY ( MM.DD.YYYYY)
or YMD ( YYYY.MM.DD ) and press
key to confirm.
3. Press
key until [ SAVE : YES ] prompt appears.
4. Press
key to save or press
or
keys to
select “NO” to return operation without
saving.
Date adjust
1. Enter the programming and go to parameter 252,
page 56
2. Press numerical keys to enter the date and press
key to confirm.
3. Press
key until [ SAVE : YES ] prompt appears.
4. Press
key to save or press
or
keys
to select “NO” to return operation without
saving.
Time adjust
1. Enter the programming and go to parameter 253,
page 56
2. Press numerical keys to enter the time and press
key to confirm.
3. Press
key until [ SAVE : YES ] prompt appears.
4. Press
key to save or press
or
keys to
select “NO” to return operation without
saving.
Tilt switch
Tilt switch is used to prevent wrong weighing in case of over tilting of platform.
Connect tilt switch to the Input 4 of the instrument and enable tilt switch by setting the parameter 51A.
[ DUE TO TILTING ] [ ------ ] prompt is displayed in case of over tilting.
Language
RELATED PARAMETERS: Parameter 236.
You can select the operation and printout language of the instrument. The available languages are English,
German, French, Italian, Spanish and Turkish. The language of programming is English, which has the
parameter code in front of parameter name for easy use.
Language selection
1. Enter the programming and go to parameter 236,
page 55
2. Press
or
keys to select language and press
key to confirm.
3. Press
key until [ SAVE : YES ] prompt appears.
4. Press
key to save or press
or
keys
to select “NO” to return operation without
saving.
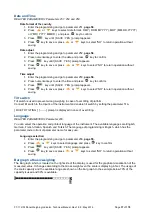
Bar graph at basic weighing
The Bar graph, which is located on the right side of the display, is used for the graphical visualization of the
measured value. It changes according to the Gross weight even the scale is displaying in Net. The usage of
the scale capacity and the available range are shown on the bar graph. In the example below 70% of the
capacity is used and 30% is available.


