46
intelliRock® III– Operating Instructions Guide
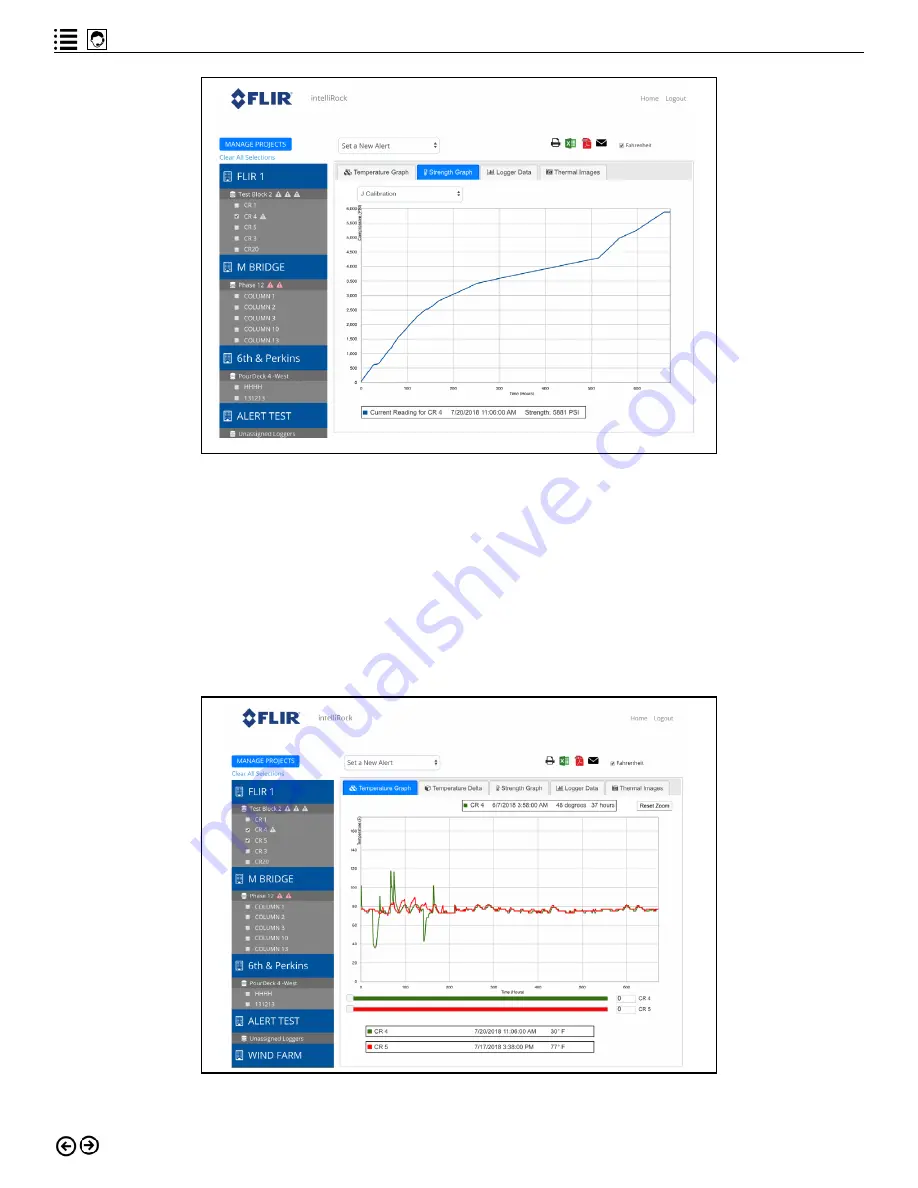
Figure 6.9: A strength graph for a selected calibration mix curve.
Synchronizing Graph Data Based on Logger Start Time
Because loggers are often placed and started at different times on a project, and concrete
often covers sensors at different times, users often want to compare logger data that occurred
at different points in time. The sliding scale feature shown in Figure 6.10 allows you to move
the graph lines of loggers and thus change the temperature comparison that is made. This
feature allows the user to compare more appropriate temperatures and line up data based on
the time concrete covered those loggers.
Figure 6.10: Synchronizing logger data graph display lines based on time.


