50
intelliRock® III– Operating Instructions Guide
Sharing Report Data
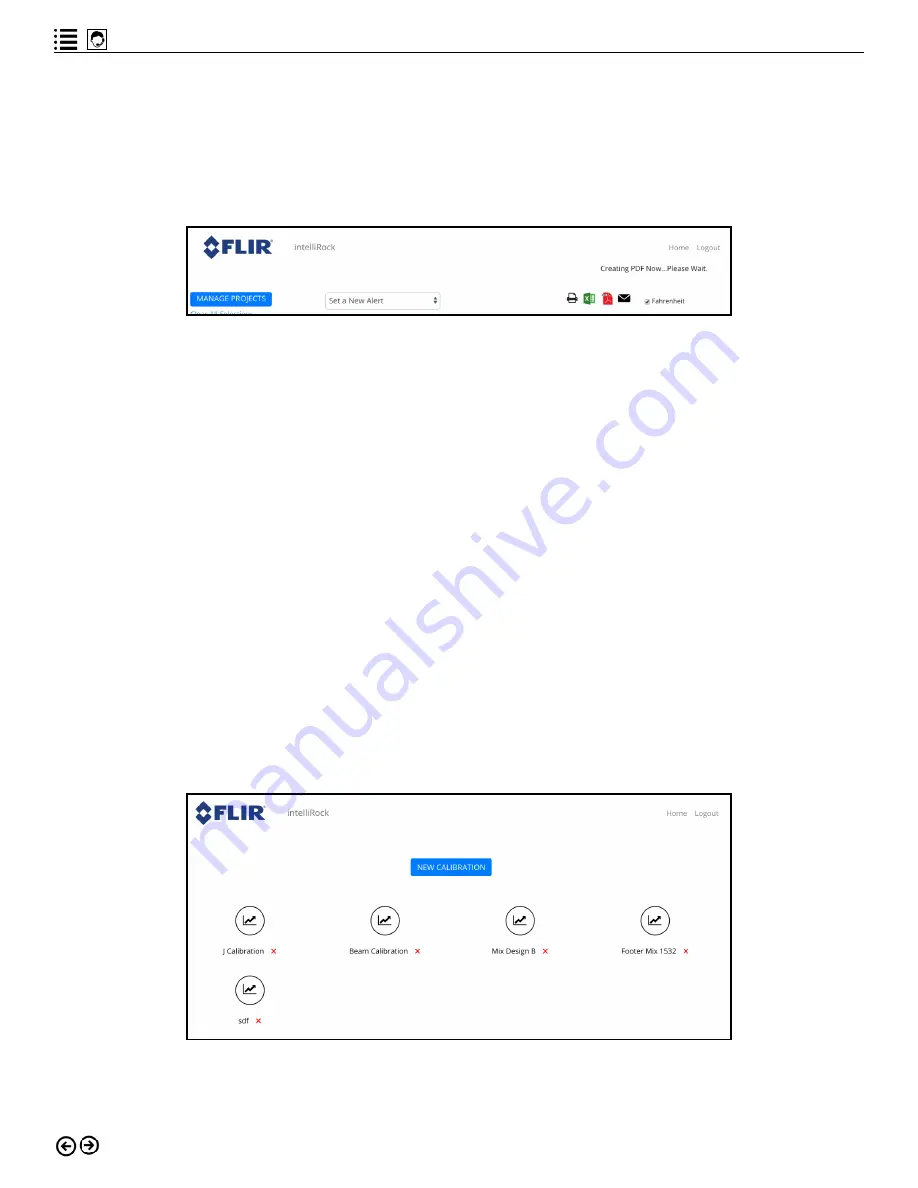
From the project home screen (Figure 6.4), reports and graphs are easy to share. Users can
print graphs and data, save them as Excel spreadsheets or PDF files, or share reports via
email. To use any of these options, use the icons located just above and to the right of the
graph, as shown in Figure 6.14.
Figure 6.14: Options for sharing report data.
Click the icon associated with the desired action to print, create report files, or email report
data:
• The printer icon will generate a screen print. Use the landscape orientation to get the
best output.
• The Excel icon will download an Excel spreadsheet containing data from the selected
logger(s).
• The PDF icon will create and download a Concrete Data Report for the selected project
that includes a summary of the selected logger(s) and the graph the user was viewing
when the icon was clicked.
• The email icon will open a pop-up window that allows the user to send a report to any
cloud user.
Calibrations
To manage existing calibrations or to enter new ones, click the “Calibrations” button from the
cloud home screen (Figure 6.2). The calibrations screen will display all calibration mix curves
that are stored in the cloud, similar to what Figure 6.15 shows.
Figure 6.15: Calibrations home screen.


