Using Fluke DAQ Software
Managing Your Network Using Fluke DAQ
3
3-41
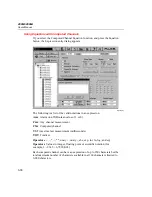
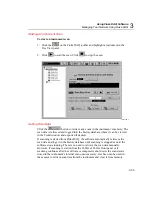
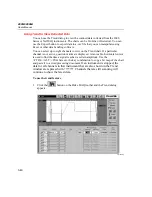
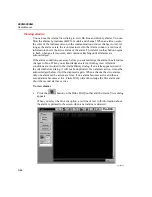
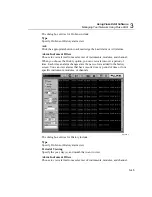
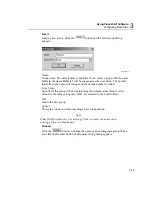
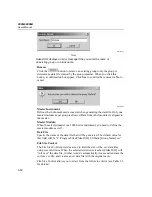
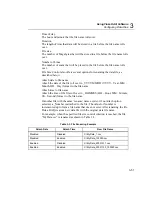
The dialog box entries include:
Type
Specify On Line or History scan view. History view shows the last set of data
displayed with the pens.
Zoom
Use
to expand or compress the time interval you are viewing.
Use
to increase or lower the amplitude resolution.
Scale Range
Select the Scale Range check box to display the scales for all the trends on the
left side of the chart.
Current Value
Select the Current Value check box to display a colored pen symbol and the
current value for each trend on the right side of the chart.
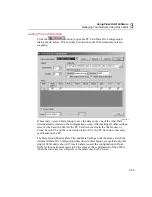
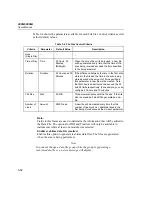
Each channel set up to display on the Trend chart has the following properties.
•
Instrument is the BCN of the instrument for the channel
•
Module selects the module number or the computed channels
•
Channel is actual channel to display for the trend line
•
Label is the description for the channel
•
Units is the measurement units for the channel
•
Minimum level is at the bottom of the chart for that trend
•
Maximum level is at the top of the chart for that trend
•
Current value is the value of the channel at the time shown on the right
edge of the chart
•
Cursor value is the value at the position of the moveable cursor for the
channel
Summary of Contents for 2680A
Page 8: ......
Page 14: ...2680A 2686A Users Manual vi ...
Page 20: ...2680A 2686A Users Manual 1 2 ...
Page 98: ...2680A 2686A Users Manual 2 62 ...
Page 196: ......
Page 228: ...2680A 2686A Users Manual A 32 ...
Page 236: ...2680A 2686A Users Manual C 4 ...
Page 242: ...2680A 2686A Users Manual D 6 ...
Page 274: ...2680A 2686A Users Manual 6 ...

