2680A/2686A
Users Manual
C-2
Waveform Comparison (True RMS vs Average
Responding)
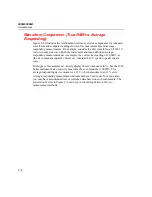
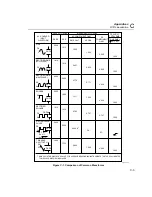
Figure C-1 illustrates the relationship between ac and dc components for common
waveforms and compares readings for true-rms measurements and average-
responding measurements. For example, consider the first waveform, a 1.41421 V
(zero-to-peak) sine wave. Both the instrument and rms-calibrated average-
responding measurement devices display the correct rms reading of 1.0000 V ac
(the dc component equals 0). However, consider the 2 V (peak-to-peak) square
wave.
Both types of measurement correctly display the dc component (0 V), but the 2680
Series instrument also correctly measures the ac component (1.0000V). The
average-responding device measures 1.11 V, which amounts to an 11% error.
Average-responding measurement instruments have been in use for a long time;
you may have accumulated test or reference data based on such instruments. The
conversion factors in Figure C-1 can help in converting between the two
measurement methods.
Summary of Contents for 2680A
Page 8: ......
Page 14: ...2680A 2686A Users Manual vi ...
Page 20: ...2680A 2686A Users Manual 1 2 ...
Page 98: ...2680A 2686A Users Manual 2 62 ...
Page 196: ......
Page 228: ...2680A 2686A Users Manual A 32 ...
Page 236: ...2680A 2686A Users Manual C 4 ...
Page 242: ...2680A 2686A Users Manual D 6 ...
Page 274: ...2680A 2686A Users Manual 6 ...

