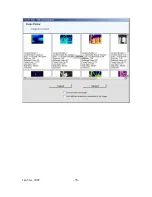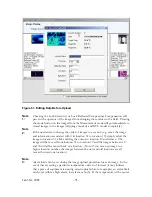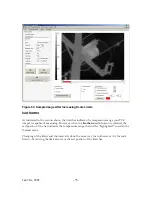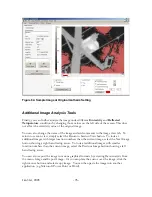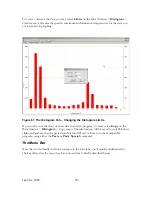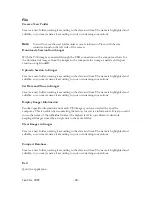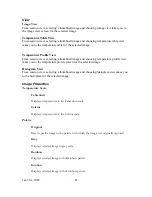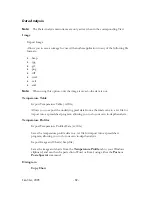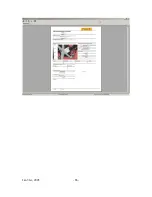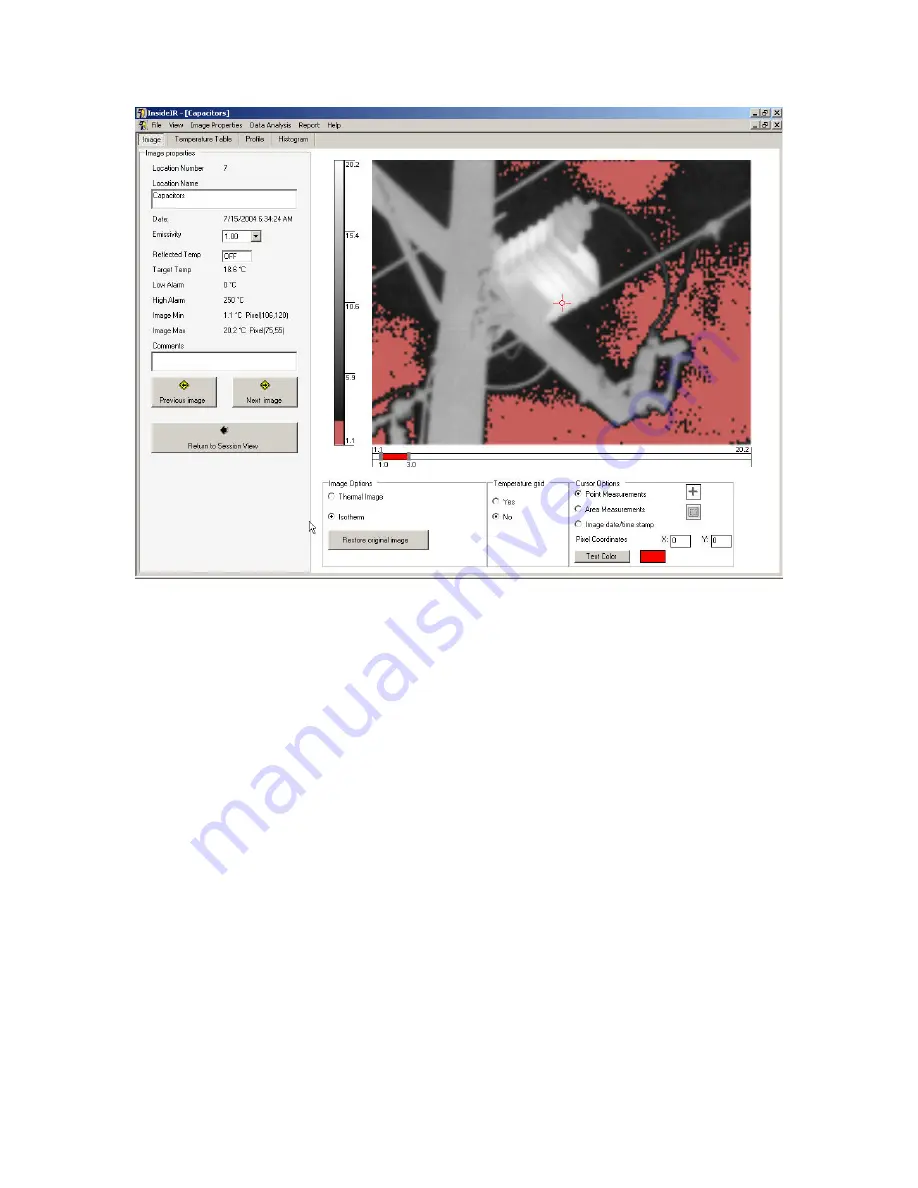
Figure 64. Sample Image at Original Isotherm Setting
Additional Image Analysis Tools
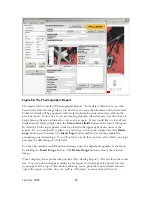
Finally, you can further analyze the image under different
Emissivity
and
Reflected
Temperature
conditions by changing those values on the left side of the screen. This does
not affect the emissivity value of the original image.
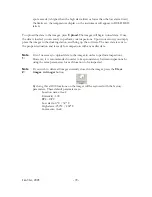
You can also change the name of the image and add comments in the image view tab. To
return to session view, simply select the Return to Session View button. To look at
additional images with larger location numbers than the current image, select the Next Image
button showing a right hand facing arrow. To look at additional images with smaller
location numbers than the current image, select the Previous Image button showing a left
hand facing arrow.
You can also export the image in various graphical formats by selecting Data Analysis from
the menu, Image and Export Image. Or you can place the cursor over the image; click the
right mouse button and select copy image. You can then paste the image into another
application (e.g. Microsoft Power Point or Word).
Jan 31st, 2005
- 76 -
Summary of Contents for Ti30
Page 4: ...Appendix B Infrared Theory Q A 92 Glossary 96 Jan 31st 2005 4 ...
Page 25: ...Man Machine Interface Flow Charts Main Loop Jan 31st 2005 25 ...
Page 26: ...Image Recording Procedure Emissivity Adjustment Procedure Jan 31st 2005 26 ...
Page 70: ...Jan 31st 2005 70 ...
Page 86: ...Jan 31st 2005 86 ...

