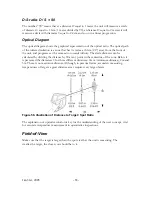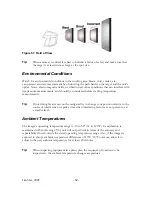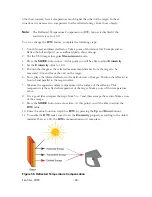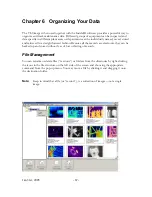
Once you have reviewed the image data at this level, you can proceed to other views of the
data.
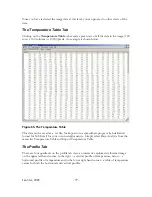
The Temperature Table Tab
Clicking on the
Temperature Table
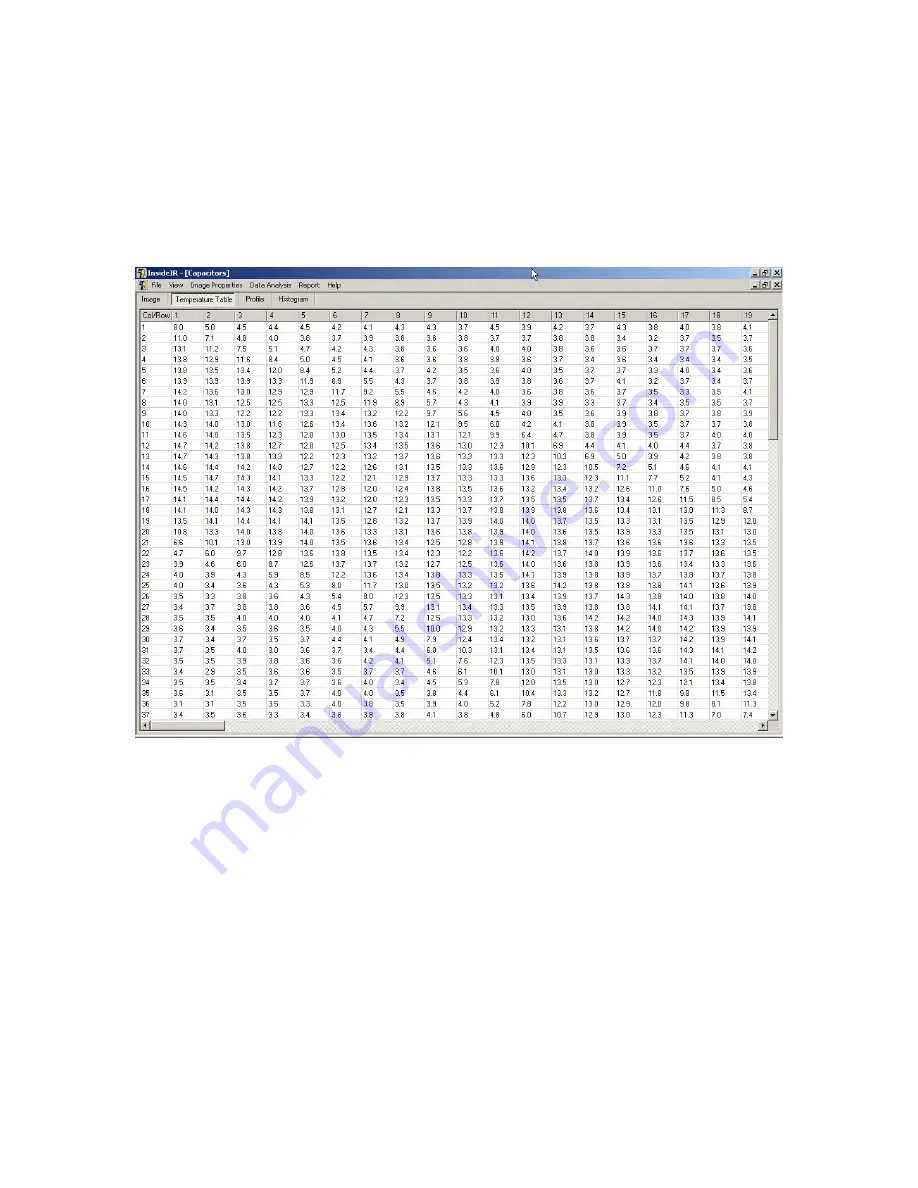
tab reveals a pixel view of all the data in the image (120
rows x 160 columns or 19,200 pixels. An example is shown below.
Figure 65. The Temperature Table
This data can be saved as a .txt file, for import into a spreadsheet program (tab delimited
format for MS Excel) for your own in-depth analysis. Simply select Data Analysis from the
menu list, Temperature Table and Export Temperature Table.
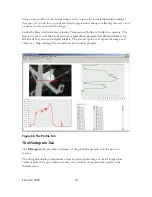
The Profile Tab
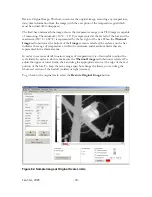
There are four quadrants on the profile tab view: an interactive radiometric thermal image
on the upper left hand corner, to the right – a vertical profile of temperature, below – a
horizontal profile of temperature and in the lower right hand corner - a table of temperature
values for both the horizontal and vertical profiles.
Jan 31st, 2005
- 77 -
Summary of Contents for Ti30
Page 4: ...Appendix B Infrared Theory Q A 92 Glossary 96 Jan 31st 2005 4 ...
Page 25: ...Man Machine Interface Flow Charts Main Loop Jan 31st 2005 25 ...
Page 26: ...Image Recording Procedure Emissivity Adjustment Procedure Jan 31st 2005 26 ...
Page 70: ...Jan 31st 2005 70 ...
Page 86: ...Jan 31st 2005 86 ...

