4-15
Sound spectrum: third-octave and octave level diagram
VIBXPERT makes the sound spectrum available for the display
and evaluation of acoustic signals. The signal picked up by the
microphone is broken down in the frequency domain into bands
with a constant relative band width (octave bands or third-octave
bands). To quantify the volume, VIBXPERT specifies the sound
pressure level of each band as well as the overall sound level.
Depending on the overall level, four evaluation filters (A, B, C, D) can
be set to take into account the human perception of volume. Since
the sound pressure level is a logarithmic quantity, a reference value
is needed to calculate it. This value must be entered as well.
The sound spectrum can only be selected for amplitude spectra
with the vibration acceleration, vibration velocity and vibration
displacement quantities, as well as for user-defined quantities.
Envelope spectra, order spectra and order-based spectra cannot be
converted into sound spectra.
Displaying the sound spectrum
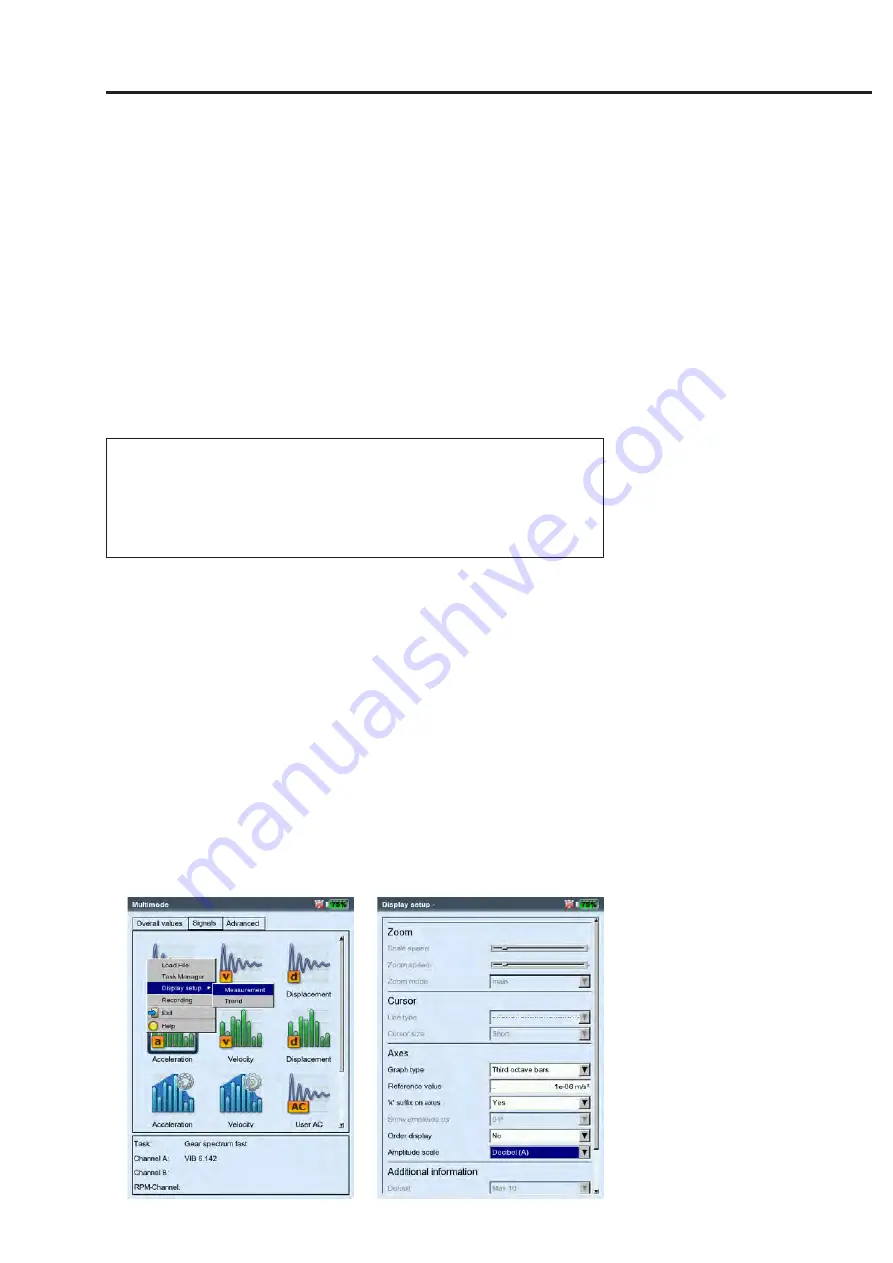
To display an amplitude spectrum as a sound spectrum, proceed as
follows:
In the Multimode selection screen:
- Mark the measurement quantity for the amplitude spectrum.
- Press the MENU button and click on ‘Display Setup/Measurement’.
In the measurement screen:
- Press the MENU button and click on ‘Display Setup’.
Left:
Open Display Setup (Multimode)
Right:
Sound spectrum settings
Graph type, reference value, amplitude
scale
Results
Note
Summary of Contents for VIB 5.310
Page 1: ...Data Collector Vibration Analyzer VIBXPERT II Users Manual ...
Page 9: ...1 8 Empty page ...
Page 51: ...2 38 Empty page ...


