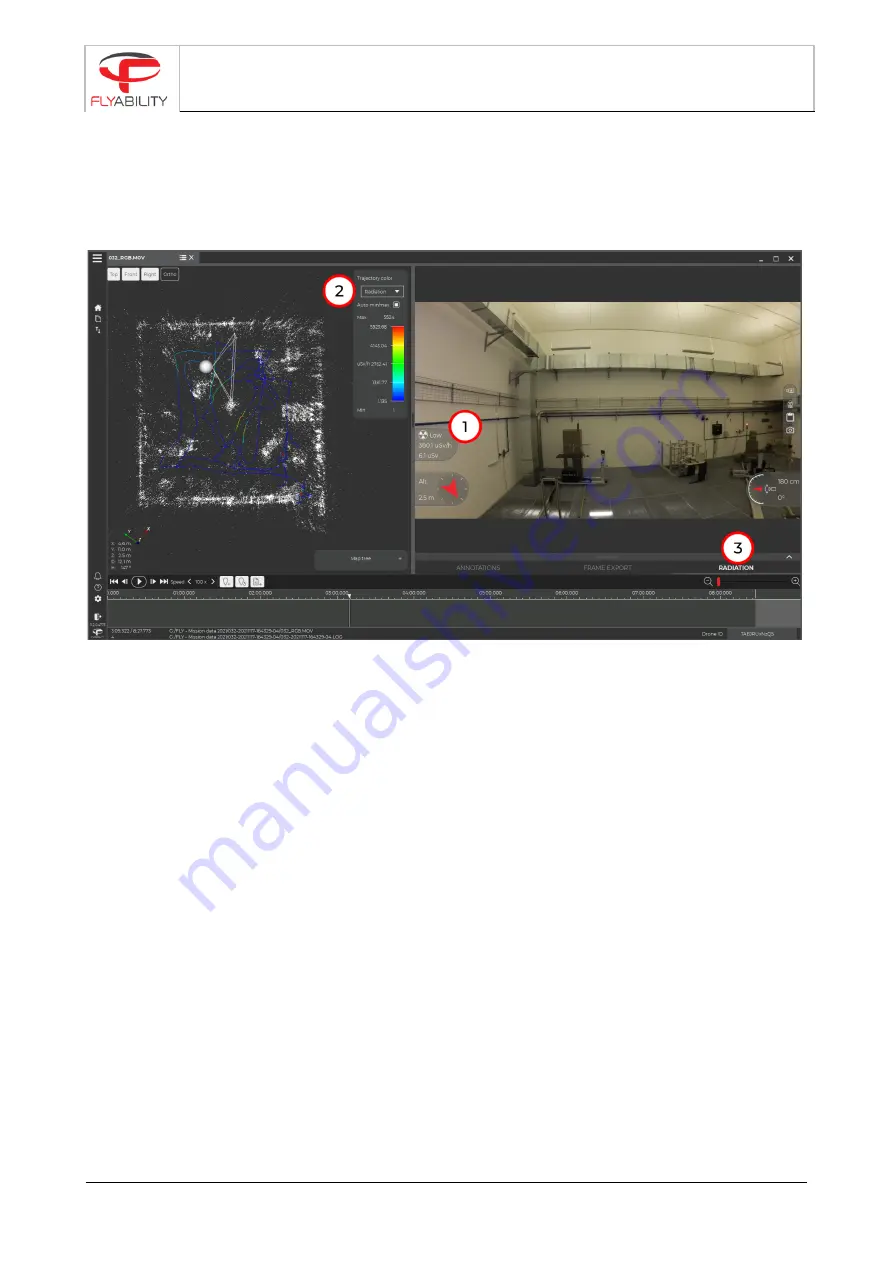
6 Post flight analysis with Inspector 3
The flight data can be downloaded onto a PC using Inspector 3. The basic version allows the dosimeter data
to be displayed alongside the video, while the premium version can re-create a 3D model of the flight
environment, with the flight path being colorized corresponding to the locally measured dose rate values.
D
OSE RATE GAUGE
(1)
This gauge will display the dose rate at the current point in the video, and the total dose absorbed
until that point in the flight. The user can choose whether the value is displayed in Sievert or Rem in
the settings menu.
T
RAJECTORY
C
OLOR BAR
(2)
This menu allows you to change the color mapping of the flight path line in the 3D model. By default,
it will autoscale from the minimum to the maximum value.
R
ADIATION TAB
(3)
Click on this tab to expand a plot of the measured dose rate throughout the flight, this allows you to
quickly identify hotspots. The lower limit of the detector is indicated in orange and the upper
(saturation) limit in red.
If a sensor disconnection was detected, the value will be equal to -1 in the graph
ELIOS 2 RAD USER MANUAL
Page 9 of 16


