Using the chassis system event log (SEL)
Using the shelf manager CLI
FortiGate-5060 Chassis Guide
66
01-400-129494-20110912
For information about shelf alarm panel LEDs see,
“FortiGate-5060 shelf alarm panel” on
. For information about cooling fan tray LEDs see
“Cooling fan trays” on page 16
.
For information about PEM LEDs, see
“Connecting a FortiGate-5060 PEM to DC power”
.
Reading the System Event Log (SEL)
Every time an event occurs in a chassis, the respective IPMC controller sends notification
to the shelf manager that the event has happened and an entry is added to the SEL. The
log entry that is created depends on the sensor that triggered the event and the type of
data that the sensor reads.
All events are logged, this includes normal system events as well as alarms and critical
events. For example, insertion a board generate a number of event log messages
because the board is now present, has notified the shelf manager that it’s ready to work,
that it’s received the command to power up into operational mode, and that it’s now active
in the chassis. This is seen as clustered entries in the SEL where the same IPMC moves
from M0-M1 all the way up to M3-M4, where M4 is fully operating.
Alarm events such as fans starting to spin at slower rates due to age, or dips in the -
48VDC power input or even blown fuses are also added to the SEL.
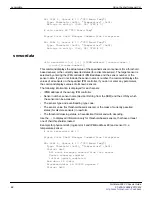
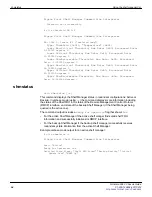
The following example event log entry records that the rear fan in Fan Tray 1 (middle fan
tray) is spinning below the required RPM rate.
0x018D: Event: at Jan 1 00:02:15 1970; from:(0x10,0,0);
sensor:(0x04,10); event:0x1(asserted): "Upper Critical",
Threshold: 0xff, Reading: 0xff
Where:
0x018D
The event ID, every new event increments by 1h. So the next event in the log
file will be tagged with
0x018E
. You can use this to keep track of what line you are on
in the file.
Event: at Jan 1 00:02:15 1970;
The date and time that the event occurred.
f
rom:(0x10,0,0);
In this string,
0x10
is the IPMC controller to which the sensor is
attached. In this message its referencing an event monitored by the shelf manager in
slot #1.
sensor:(0x04,10);
The first part
0x04
can be ignored, the
10
shows the ID of the
Sensor that generated the alarm.
event:0x1(asserted):
Sensors show when an event is triggered because of
something going wrong, but also when they return to normal. In this case,
asserted
is
the key point, meaning that the sensor has observed that the device has gone outside
the bounds or thresholds that have been set for it. Had this contained
deasserted
it
would mean the device has returned to its normal operating mode.
Upper Critical", Threshold:
ss a reference to the specific threshold level that
the device exceeded. Some events like thermal events could have multiple threshold
levels. The first event could simply notify the shelf manager that it’s getting too hot, to
which the shelf manager would then notify the fans in the system to speed up to help
cool the board better, at which point the sensor would
deassert
the event. Another,
higher level thermal event could notify the shelf manager that the board has now
exceeded its maximum thermal operating limit, to which the shelf manager would tell it
to deactivate and shut down.
Reading: 0xff
represents a raw value sent with the event, typically for more
technical troubleshooting review by the manufacturer. Data is rarely published for
these values.

