Using the shelf manager CLI
Shelf manager CLI commands
FortiGate-5140B Chassis Guide
01-500-156415-20151104
55
sel
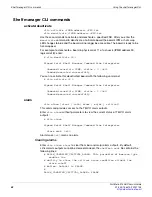
clia sel [-v] [<IPMB-address> [<record-count> [starting-entry]]]
clia sel clear [<IPMB-address>]
clia sel info [<IPMB-address>]
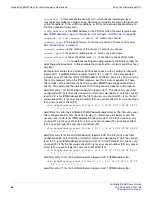
The System Event Log (SEL) is useful for troubleshooting as shown in the examples
below.
The
sel
command shows the contents of the SEL on the specified IPM Controller (at
IPMB address 20h by default). The optional
<record-count>
indicates how many
records from the record number
<starting-entry>
in the SEL are displayed. The
optional parameter
<starting-entry>
is the entry number of the first SEL record to
print, relative to the beginning of the SEL. Both
<record-count>
and
<starting-
entry>
must be within the range of 1 to the total number of records in the SEL. The
default value of the optional parameter
<starting-entry>
is 1. The
<starting-
entry>
is independent of the
RecordID
field of the SEL record.
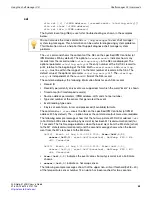
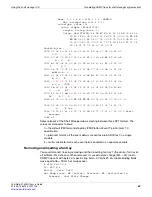
The command displays the following information fields for each SEL record:
•
Record ID
•
Record type (currently only events are supported, for which the word “Event” is shown
•
Timestamp (for timestamped records)
•
Source address parameters: IPMB address, LUN and channel number
•
Type and number of the sensor that generated the event
•
Event/reading type code
•
3 bytes of event data, in raw and processed (if available) formats.
The command
sel clear
clears the SEL on the specified IPM Controller (at IPMB
address 20h by default). The
-v
option makes the command output more user-readable.
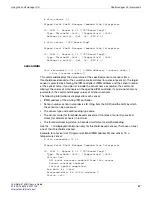
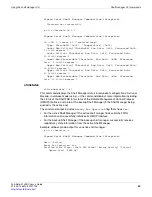
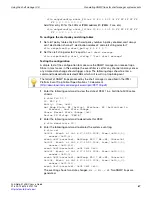
The following example messages show that the hot swap state of FRU 0 at address
0x86
(a FortiGate-5000 series board in physical slot 6) has been M7 (communication lost) for
11 seconds. The first message indicates when the board went from the M4 state (active)
to the M7 state (communication lost) and the second message shows when the board
went from the M7 state back to the M4 state.
0x0332: Event: at Aug 5 11:07:18 2009;
from:(0x86,0,0)
;
sensor:(0xf0,0)
; event:0x6f(asserted): HotSwap: FRU 0 M4-
>M7, Cause=0x4
0x0333: Event: at Aug 5 11:07:29 2009; from:(0x86,0,0);
sensor:(0xf0,0); event:0x6f(asserted): HotSwap: FRU 0 M7-
>M4, Cause=0x4
•
from:(0x86,0,0)
indicates the event comes from physical slot 6 of a FortiGate
chassis.
•
sensor:(0xf0,0)
indicates a hot swap sensor.
The following example messages show that the upper non-critical threshold (0x28 = 40)
of the temperature sensor number 12 on slot 6 has been reached for two seconds.
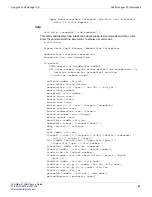
You can also use the Linux command
cat /tmp/messages
to view shelf manager
system log messages. This information can be useful for diagnosing system problems.
This information can also help Fortinet Support diagnose shelf manager system
problems.


