Fredenstein F610 Universal Entzerrer UE-1
Equalizer Screen
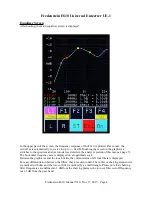
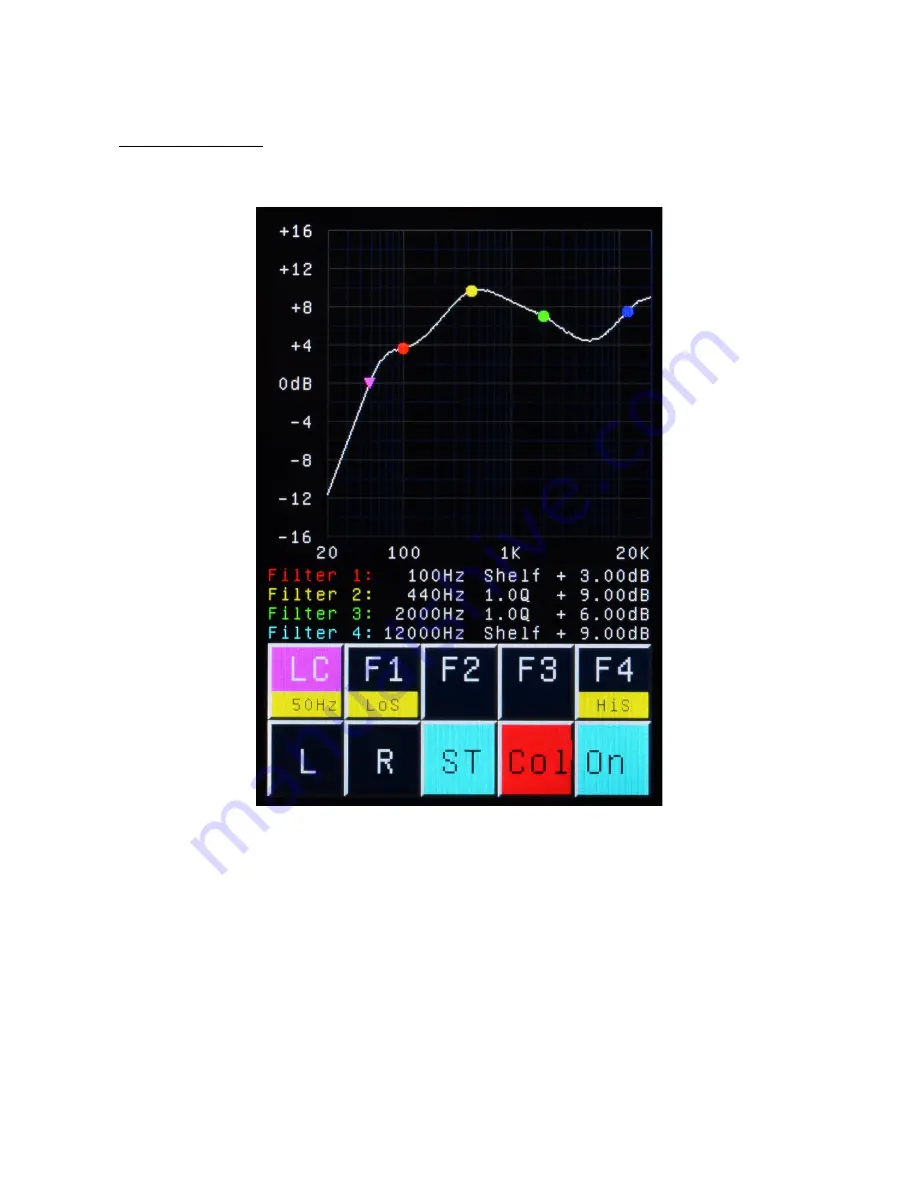
After booting, the main equalizer screen is displayed:
In the upper part of the screen, the frequency response of the F610 is plotted. Please note: the
vertical axis automatically re-scales to up to +/- 64 dB. Touching the screen in the graph area
switches to the spectrum analyzer mode (see details in the analyzer section of this manual, page 7).
The horizontal frequency axis is displayed on a logarithmic scale.
Between the graph area and the touch fields, the current status of all four filters is displayed.
For easy differentiation between the filters, they are color-coded. The center or shelving frequencies
are marked with dots and the low-cut filter is marked by a small triangle. Please note that shelving
filter frequencies are defined at -3 dB from the shelving plateau, the low-cut filter cut-off frequency
is at -3 dB from the pass band.
Fredenstein F610 Manual V1.0 Nov 17, 2017 Page 4


