74
Display
(continued)
(12)
(1)
(2)
(3)
(4)
(5)
(6)
(7)
(8)
(9)
(10)
(11)
(13)
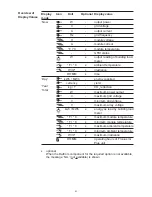
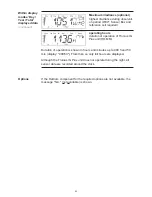
Display
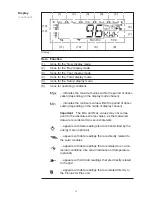
... indicates the maximum value within the period of obser-
vation (depending on the display mode chosen)
... indicates the minimum value within the period of obser-
vation (depending on the mode of display chosen)
Important
The Min. and Max. values may not corres-
pond to the absolute extreme values, as the measured
data are recorded at two second intervals.
... appears with data readings that are transmitted by the
energy meter (optional)
... appears with data readings that are directly related to
the solar modules
... appears with data readings that are related to environ-
mental conditions, like solar irradiance and temperature
(optional)
... appears with AC data readings that are directly related
to the grid
... appears with data readings that are related directly to
the Fronius IG Plus unit
Item
Function
(1)
Icons for the ‘Now’ display mode
(2)
Icons for the ‘Day’ display mode
(3)
Icons for the ‘Year’ display mode
(4)
Icons for the ‘Total’ display mode
(5)
Icons for the ‘Setup’ display mode
(6)
Icons for operating conditions
Summary of Contents for IG Plus 12.0-3
Page 2: ......
Page 4: ...ud_fr_st_et_01382 012008...
Page 6: ......
Page 16: ...6...
Page 17: ...7 General Information...
Page 18: ...8...
Page 24: ...14...
Page 25: ...15 Installation and Startup...
Page 26: ...16...
Page 80: ...70...
Page 81: ...71 Operation...
Page 82: ...72...
Page 122: ...112...
Page 123: ...113 Troubleshooting and Maintenance...
Page 124: ...114...
Page 149: ...139 Appendix...
Page 150: ...140...

