700 – Axiom - H1 Overview– Rev 7 - 03 Aug 2017
22/37
3.3.2.1
Current Conditions
Screens accessed from the
Home
screen
Current Conditions
icon allow the user to define a custom set of
data points which can be simultaneously displayed. The data points selected for the Current Conditions
display can be manually refreshed or be automatically refreshed every minute (for up to 60 minutes).
Built-in sensors are read every time a manual or automatic refresh event occurs whereas SDI sensors
displays the last value read from the sensor. A process returns the current value of the process at the
time the refresh was selected.
Audit log
3.3.3
A chronological summary of significant Datalogger events is captured in the Datalogger’s audit log text
file. The Audit log is a circular file in which the newest message overwrites the oldest message once the
file has reached its maximum size (20 kB). The audit log file is viewed by pressing
Audit Log
on the
Service
screen. The user can clear the audit log file or save the file to a USB memory stick.
3.4
Data status
To access the
Data Status
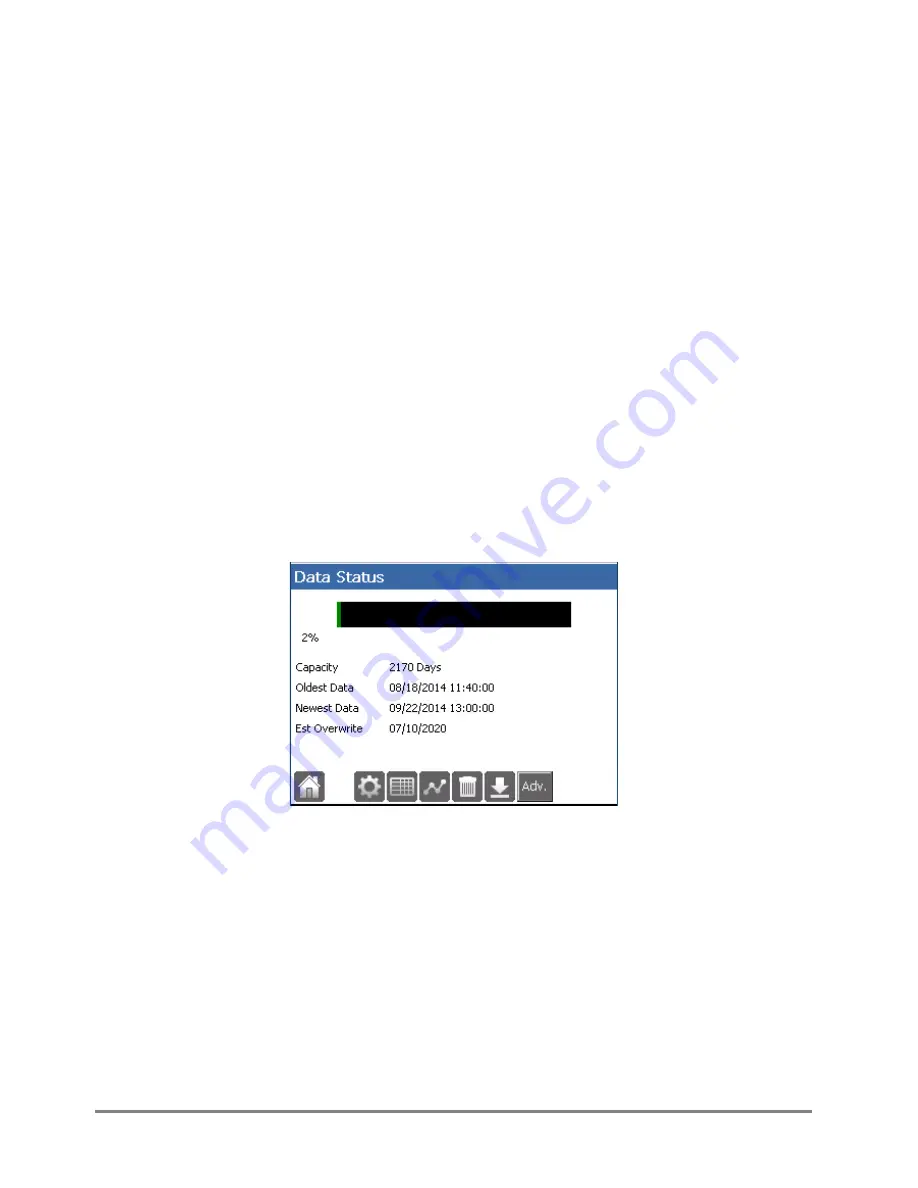
screen (Figure 7) press
Data
on the
Home
screen.
Data Status
shows a summary of the data which has been recorded in the Datalogger and allows
examination of that data. (“Data Status” does not refer to the quality of the data collected.) The
Data
Status
screen also provides the user options to configure datalogging or examine recorded data.
Figure 7: Data Status screen
Data storage information
3.4.1
The Datalogger stores data in a non-volatile circular 14 MB file. Once the data file is full, the Datalogger
begins to overwrite the oldest stored data.
3.4.1.1
Percentage full
A bar graph showing the percentage of the file already used for data storage full is displayed. The
percentage full is a calculation of the actual number of bytes used out of the available for data storage.
This bar is typically green but turns yellow when the Datalogger starts to overwrite the oldest data.


