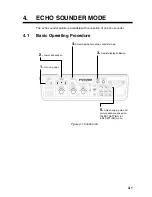

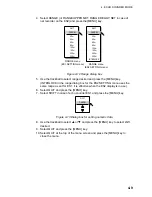
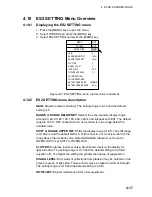
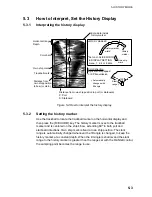


4. ECHO SOUNDER MODE
4-14
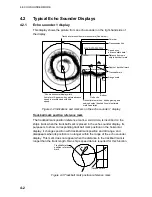
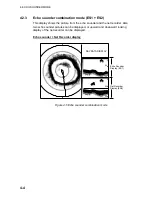
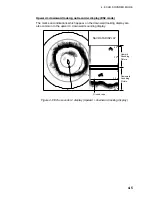
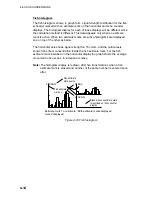
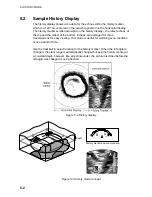
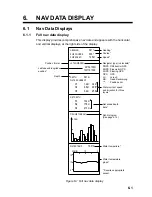
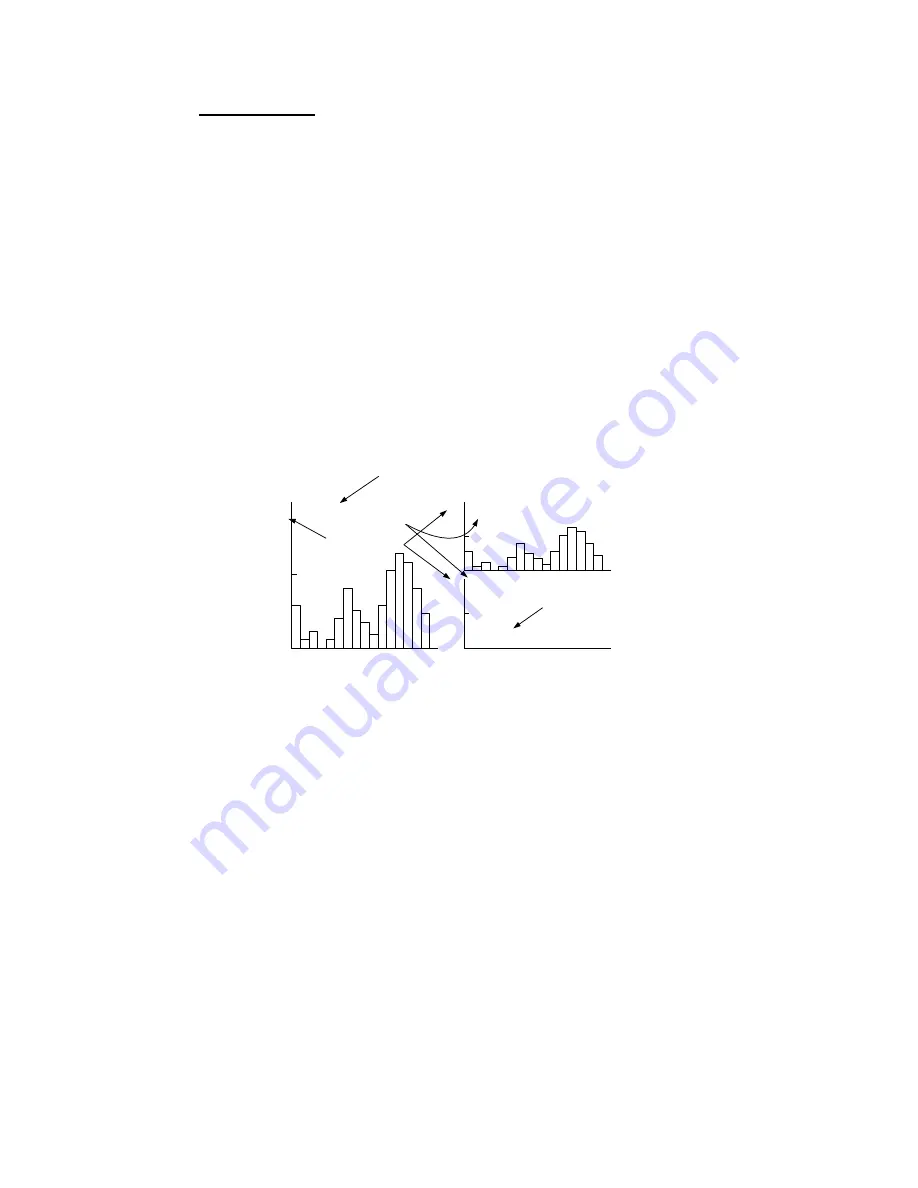
Fish histogram
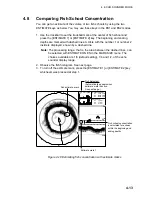
The fish histogram shows, in graph form, signal strength distribution for the fish
school(s) marked with an estimate mark on the horizontal and echo sounder
displays. The histogram display for each of those displays will be different since
the calculation method is different. This data appears only when an estimate
mark is active. When two estimate marks are active histograms are displayed
one on top of the other as below.
The horizontal axis shows signal strength in 16 colors, and the vertical axis
shows fish school concentration inside the fish estimate mark. For the fish
estimate mark inscribed on the horizontal display the graph shows the average
movement in five scans, to increase accuracy.
Note:
The histogram display is redrawn after five transmissions when a fish
estimate mark is erased and another of the same number is entered soon
after.
2
1
2
SCAN
SCAN
ES2
Fish estimate
mark source
Fish estimate
mark no.
Blank when no estimate mark
is inscribed on the horizontal
display
Estimate mark 1 or estimate
mark 2 displayed
Both estimate marks displayed
Figure 4-19 Fish histogram
Summary of Contents for FSV-24
Page 1: ...COLOR SCANNING SONAR FSV 24 ...
Page 12: ...This page is intentionally left blank ...
Page 112: ...This page is intentionally left blank ...
Page 126: ...This page is intentionally left blank ...
Page 144: ...This page is intentionally left blank ...
Page 162: ...This page is intentionally left blank ...