
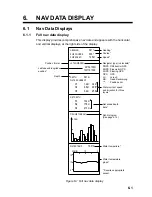


6. NAV DATA DISPLAY
6-4
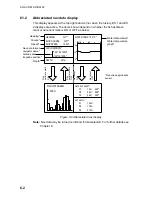
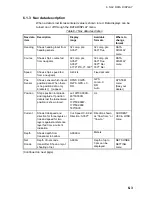
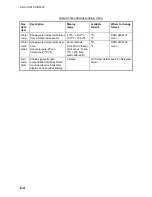
Table 6-1 Nav data description (cont.)
Nav
data
item
Description Display
range
Available
formats
Where to change
format
Water
temp.
Shows water temperature input
from a temperature sensor.
-10
°
C - +40.0
°
C,
15.0
°
F - 105.0
°
F
°
C,
°
F
DATA DISPLAY
menu
Water
temp.
graph
Shows water temperature over
time.
Horizontal axis: 20 min.
Vertical axis:
°
C(
°
F)
Horizontal axis:
Time 20 min (fixed)
Vertical axis: Temp.
5
°
C, 10
°
F, fixed
width, auto shift)
°
C,
°
F
DATA DISPLAY
menu
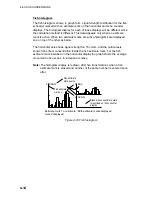
Fish
histo-
gram
Shows signal strength
concentration of fish estimate
mark inscribed on horizontal
display, echo sounder display
2 marks
For further details see Fish histogram
below.
Summary of Contents for FSV-24
Page 1: ...COLOR SCANNING SONAR FSV 24 ...
Page 12: ...This page is intentionally left blank ...
Page 112: ...This page is intentionally left blank ...
Page 126: ...This page is intentionally left blank ...
Page 144: ...This page is intentionally left blank ...
Page 162: ...This page is intentionally left blank ...


