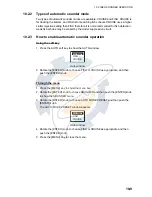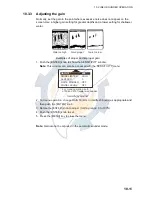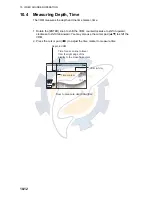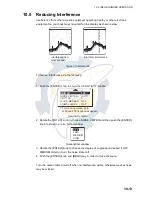
10. VIDEO SOUNDER OPERATION
10-2
10.1
Sounder Display
10.1.1
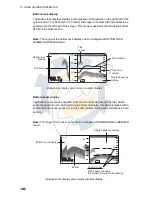
Description of sounder display
Indications on the single frequency display
Single frequency
50 kHz picture
The sounder uses ultrasonic pulses to detect bottom conditions. The lower the fre-
quency of the pulse, the wider the detection area. Therefore, the low frequency is use-
ful for general detection and judging bottom condition.
200 kHz picture
The higher the frequency of the ultrasonic pulse the better the resolution. Therefore,
the high frequency is ideal for detailed observation of fish school.
Sounding area and transmission frequency
Color bar
Depth scale
Tx frequency
Depth
50
30
Temp
scale
Water
temp
graph
50.0
Minute marker
Bottom echo
Zero line
Fish
echo
40
0
50
100
150
Time
marker
0'30"
Time
200k
120
ft
Depth to VRM
VRM
50k frequency
200k frequency
www.reelschematic.com
www.reelschematic.com

