Analyzing Recorded Data
56
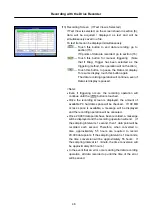
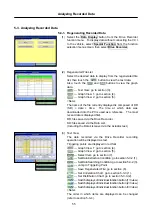
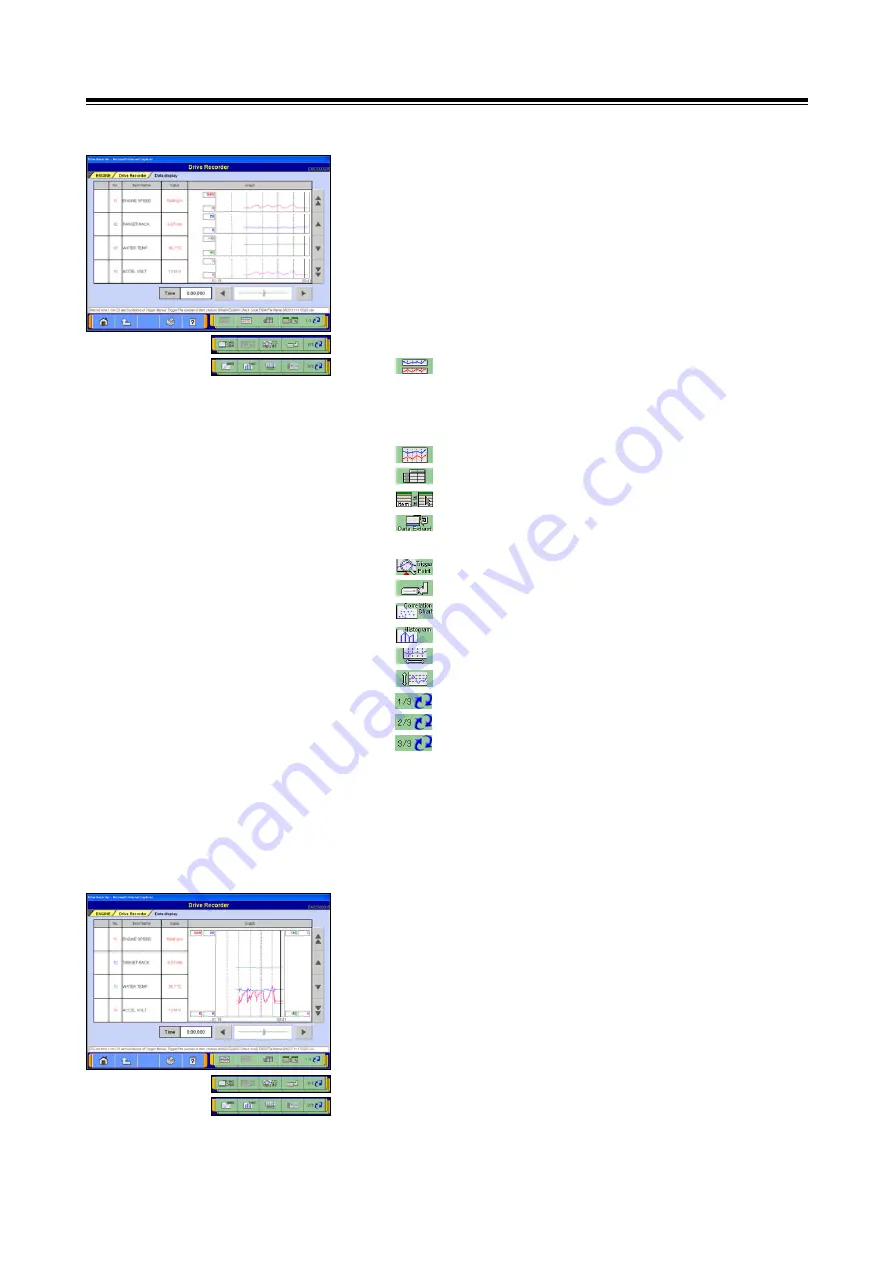
(4) Graph View 1
The data recorded via the Drive Recorder recording
operation will be displayed in the form of a graph.
The points currently displayed are indicated by pink dotted
lines. Trigger points are indicated by solid red lines.
During recording, the section where Graph View is paused
will be indicated by a solid black line. The section where
Graph View has resumed will be indicated by a solid gray
line.
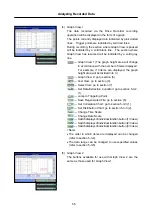
--- Graph View 1 (The graph height area will change
in accordance with the number of items displayed.
For example, if 3 items are displayed, the graph
height area will be divided into 3.)
--- Graph View 2: go to section (5).
--- Text View: go to section (3).
--- Select Item: go to section (7).
--- Set Data Extraction Condition: go to section 5-3-2.
(1).
--- Jump to Triggering Point
--- Save Regenerated File: go to section (6).
--- Set Correlation Chart: go to section 5-3-3.(1).
--- Set Distribution Chart: go to section 5-3-3.(2).
--- Change Time Scale
--- Change Data Scale
--- Switch displays of individual function button (1/3 view)
--- Switch displays of individual function button (2/3 view)
--- Switch displays of individual function button (3/3 view)
<Note>
•
The order in which items are displayed can be changed
(refer to section 5-3-4).
•
The data range can be changed to user-specified values
(refer to section 5-3-5).
(5) Graph View 2
The buttons available for use with Graph View 2 are the
same as those used for Graph View 1.

