Analyzing Recorded Data
59
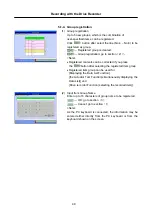
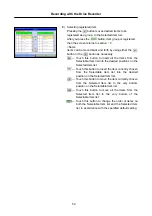
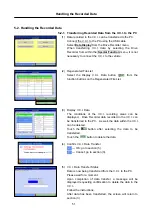
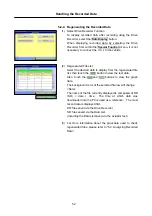
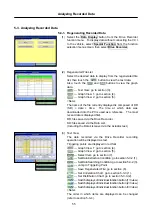
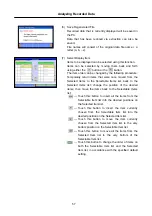
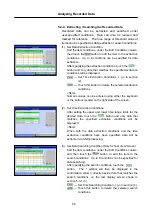
(4) Set Time Searching Condition
After setting the time range for the desired data to search,
ouch the button. The * symbol will then be
displayed in the confirmation column, directly beside data
that matches the search conditions, on the text display
screen shown in section 5-3-1.(3).
<Note>
When both the Data Searching Conditions and the Time
Searching Conditions have been specified, data will be
searched via AND processing.
<Information About Setting the Conditions>
•
Item Name: use to select the items for which conditions
are to be specified.
•
Threshold Value: a value that can be used as a standard.
•
UP: specification of a condition that has a value greater
than the threshold value.
•
DOWN: specification of a condition that has a value less
than the threshold value.
•
Level: all data that matches the specified conditions.
•
Edge: data that is at the point where its status changes,
from not matching the specified conditions, to
matching the specified conditions.
5-3-3. Displaying the Correlation Chart / Distribution Chart
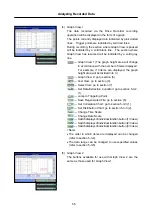
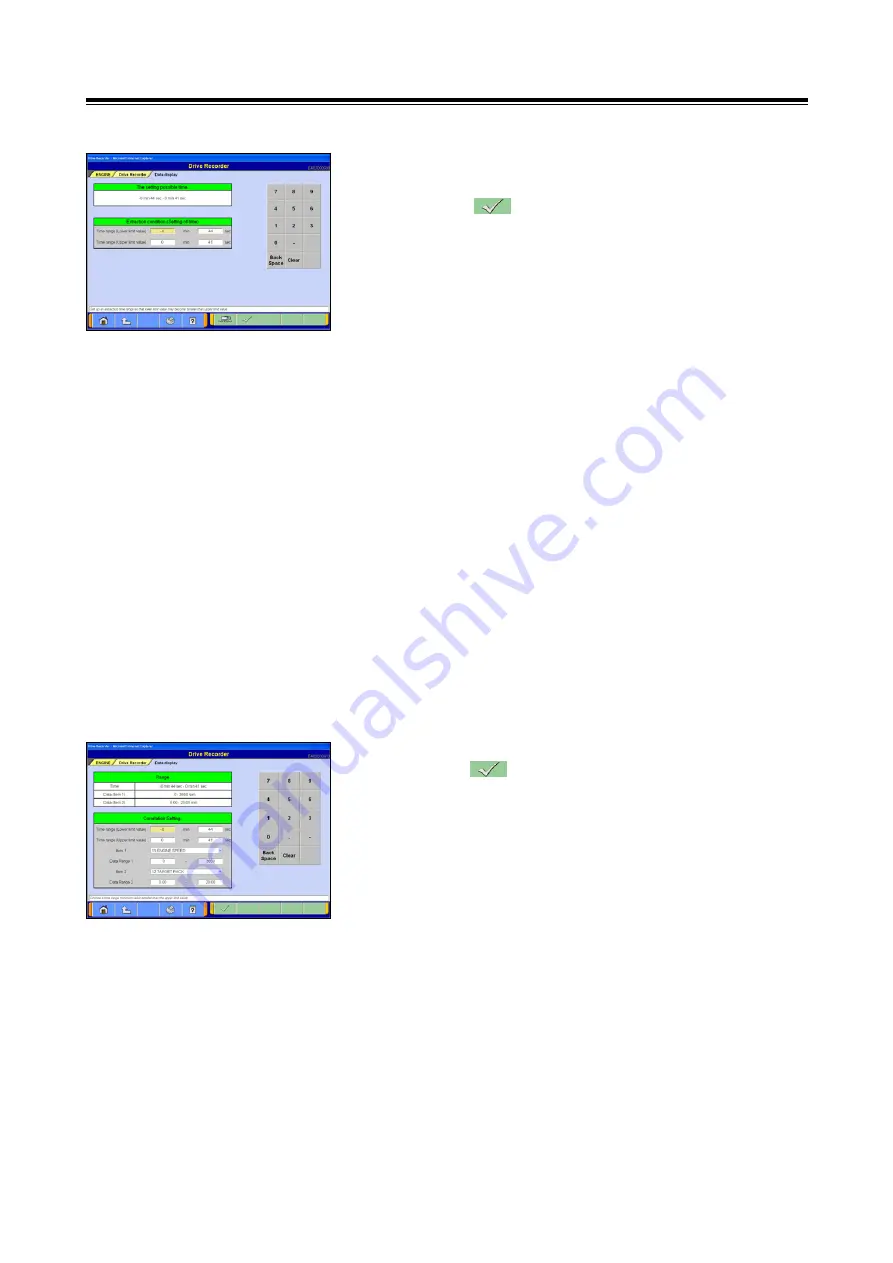
(1) Set Correlation Chart
Touch the button to display the correlation chart, after
first specifying the time range for the subject data, as well
as the item names and display ranges for each data group.
Analog data and voltage data can be plotted on the
correlation chart.
Subject item 1 will be plotted on the vertical axis of the
correlation chart and subject item 2 will be plotted on the
horizontal axis of the correlation chart.
•
Time Range: time range for the data to be plotted.
•
Subject Item 1: item plotted on the vertical chart axis.
•
Data Range 1: range of data for the item plotted on the
vertical axis.
•
Subject Item 2: item plotted on the horizontal chart axis.
•
Data Range 2: range of data for the item plotted on the
horizontal axis.
<Note>
Numeric values can be entered using either the keyboard
or the buttons located on the right side of the screen.

