14
Section 3. Doppler QA
4
If available, set the ultrasound system to display a curve that shows
TAMAX
(a continuous
estimate of the maximum velocity on the spectral display), and
TAMEAN
(a continuous
estimate of the mean velocity on the spectral display).
5
Reduce the sample volume gate to
2 mm
, and position the gate so that it is centered on the
horizontal vessel axis.
6
Apply
angle correct
so that the angle correct cursor is parallel to the direction of flow, i.e., the
vessel axis.
7
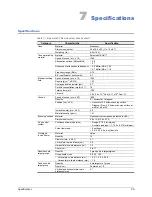
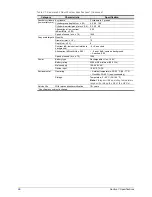
Use the values in Table 3-1 to compare the displayed peak value of the ultrasound system’s
Doppler signal spectrum with the estimated peak velocity as calculated from the flow rate
displayed on the phantom control panel.
8
Record the results on the Doppler QC Test Data Sheet.
9
Repeat steps
at a range of flow rates from low to high.
Sample Gate Positioning Accuracy
The sample gate, or volume cursor, indicates the region in the imaged volume from which Doppler
information is collected for analysis. The Sample Gate Positioning test evaluates the accuracy of
the cursor’s location in the phantom with its representation on the B-mode image.
For this test, a small gate size produces better results.
1
Set the phantom to CONTINUOUS mode with a mid-range (5–7 ml/s) flow rate.
2
On the ultrasound system, set the sample volume gate size to between 1 mm and 1.5 mm.
3
Record the phantom mode and rate, and ultrasound system gate size.
4
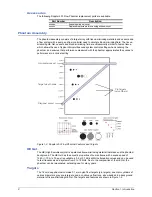
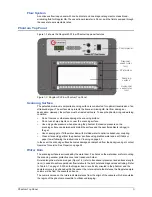
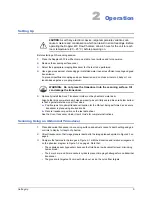
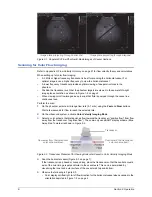
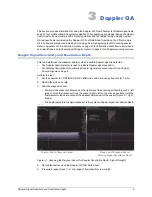
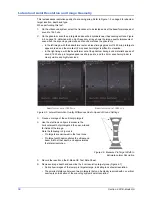
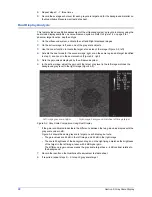
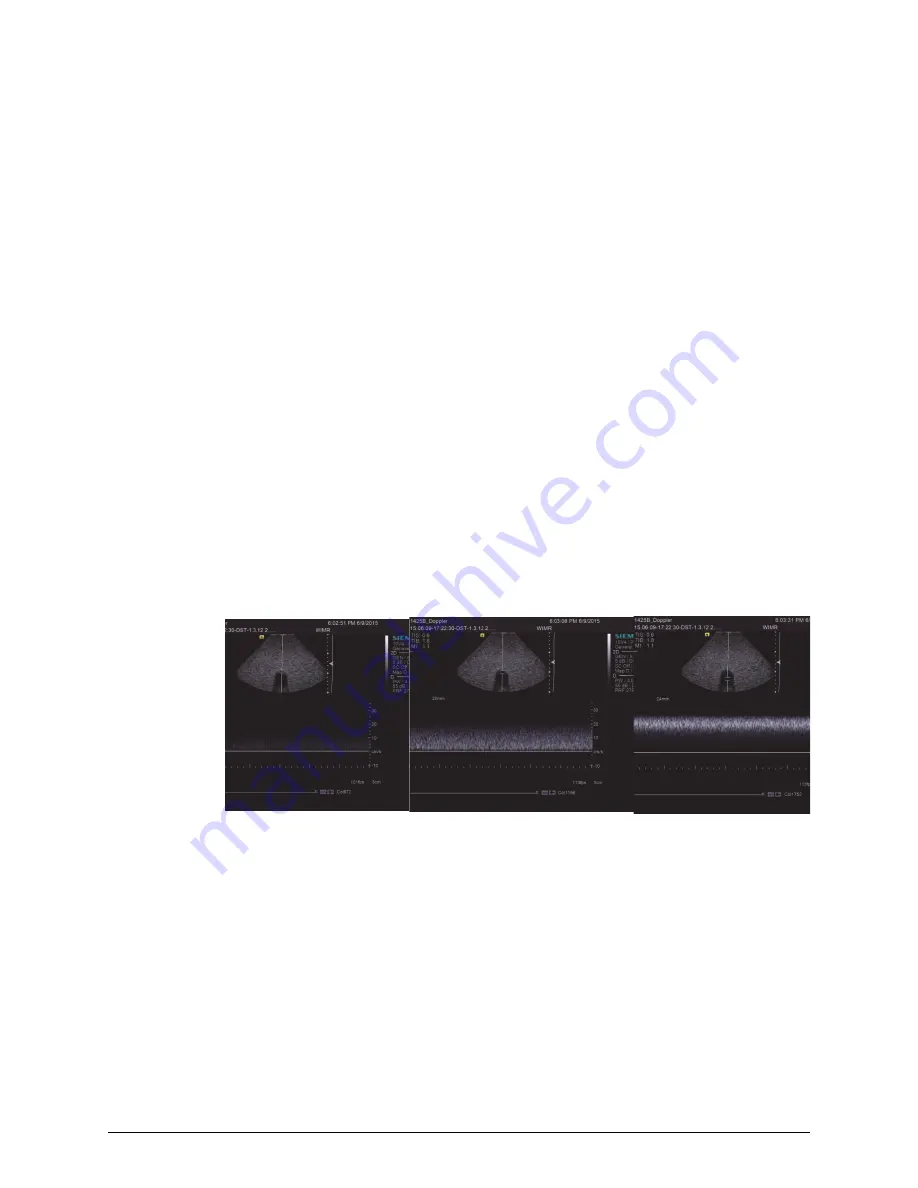
Scan the diagonal vessel so that the image displayed is a cross-section of the vessel (Figure
3-7).
5
Place the cursor at several locations across the vessel and measure the flow rate.
• The highest velocity reading should occur when the cursor is centered along the vessel axis.
• If the highest apparent velocity occurs when the cursor is off-center, on the edge, or outside
the vessel, service is recommended.
Figure 3-7. Scanning the Diagonal Vessel for Sample Gate Positioning Accuracy
6
Record the results on the Doppler QC Test Data Sheet.


