Gray Scale Applications
35
In order for phantoms to present valid resolution results for harmonic imaging, these three tissue
properties must adequately correspond to those of human tissue. Attenuation in soft tissue
increases with frequency, approximately proportional to f
1
, where f is the frequency in MHz. This
attenuation property must be present in any phantom used to study harmonic imaging performance.
The ratio B/A quantifies the rate of transfer with respect to propagation distance of ultrasonic
fundamental frequency energy to harmonic frequencies. B/A ranges from about 6 for nonfat tissue
to over 10 for adipose tissue
1
. Tissue-mimicking phantoms are appropriate for assessing harmonic
imaging only if the B/A value for the tissue-mimicking material in the phantom adequately
approximates that of soft tissues. The B/A value for the tissue-mimicking material in the Doppler 403
Flow Phantom lies in the range of non-adipose human soft tissue, or between 6 and 7
2
.
Gray Scale Applications
Both normal and abnormal structures in the body are sometimes discernible because they are
slightly hyperechoic or hypoechoic compared with the surrounding tissue. If the ultrasound system’s
frequency and gray level display are not accurate, these features may not be represented
consistently.
Ultrasound systems use special processing algorithms to translate the amplitude of echoes into
brightness levels on the system display. The most important algorithm is logarithmic compression,
which enables a large amplitude range of echo signals, for example, 65 dB, to be displayed as
shades of gray within the black-to-white range of a system display. Additionally, post-processing
algorithms apply mathematical functions, sometimes producing an S-shaped curve when the mean
pixel value data versus the target echo level are plotted. For a given set of operating conditions,
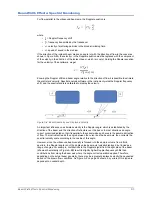
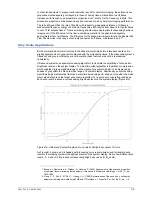
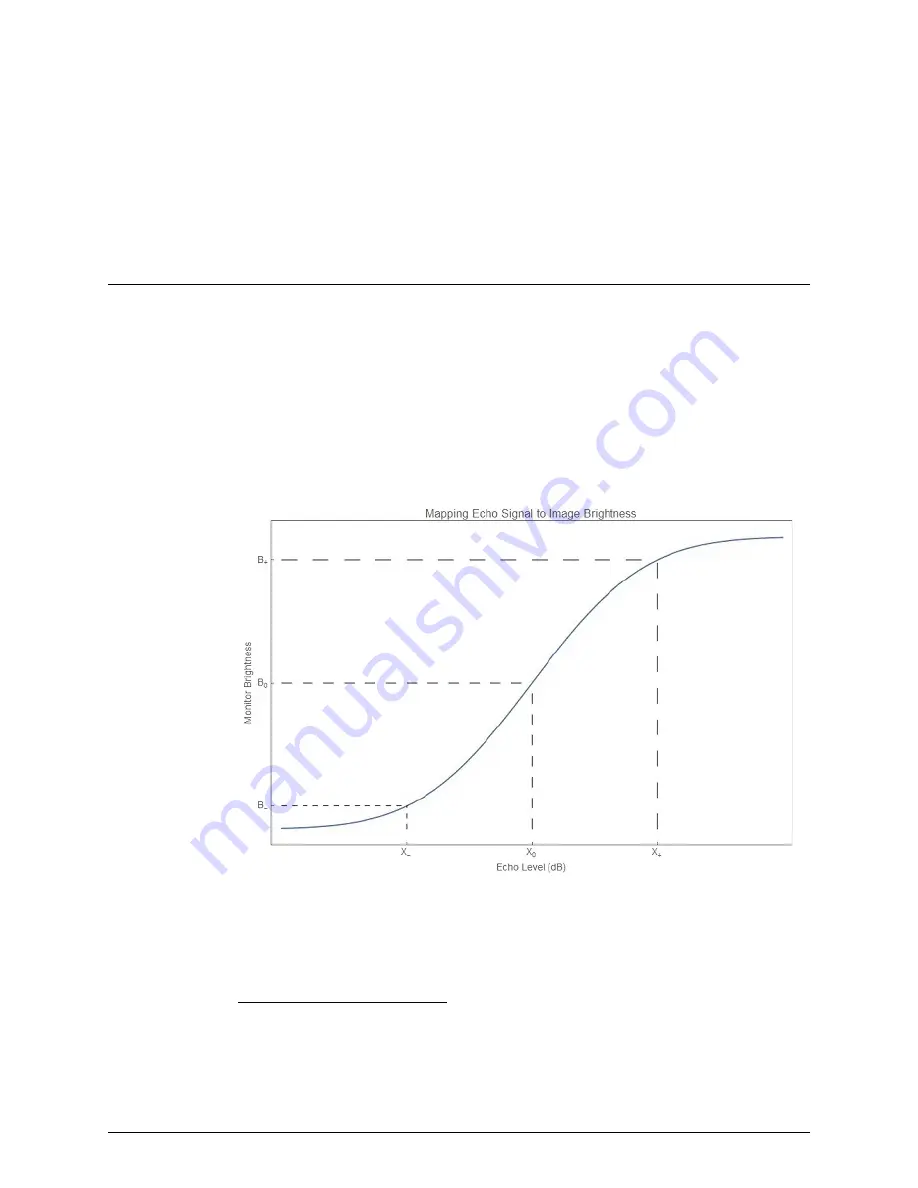
each echo level produces a corresponding brightness level on the system display (Figure B-5).
Figure B-5. Ultrasound System Display Echo Levels and Brightness Levels S-Curve
As Figure B-5 shows, an S-shaped post-processing curve is sometimes used to translate echo
levels in the imaging system into brightness levels on the system display. Notice how different echo
levels, -X, 0 and +X dB, produce corresponding brightness values B
-
, B
o
and B
+
.
1. Browne, J. Ramnarine, K., Watson, A., Hoskins, P. (2003). Assessment of the acoustic properties
of common tissue-mimicking test phantoms. Ultrasound in Medicine and Biology, Vol. 29 (7), pp.
1053–1060.
2. Gong, X. F., Zhu, Z. M., Shi, T., Huang, J. H. (1989) Determination of the acoustic nonlinearity
parameter in biological media using FAIS and ITD methods, J. Acoustic. Soc. Am. 86 (1), pp. 1–5.

