background image

Directional Discrimination

11

1

Set the phantom to CONTINUOUS mode with a low (1–2 ml/s) flow rate. 

2

Record the mode and rate.

3

On the ultrasound system, set the color flow output power and color gain for maximum 
sensitivity without excessive noise.

4

Scan the diagonal vessel.

5

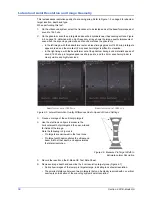
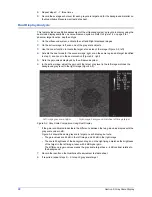
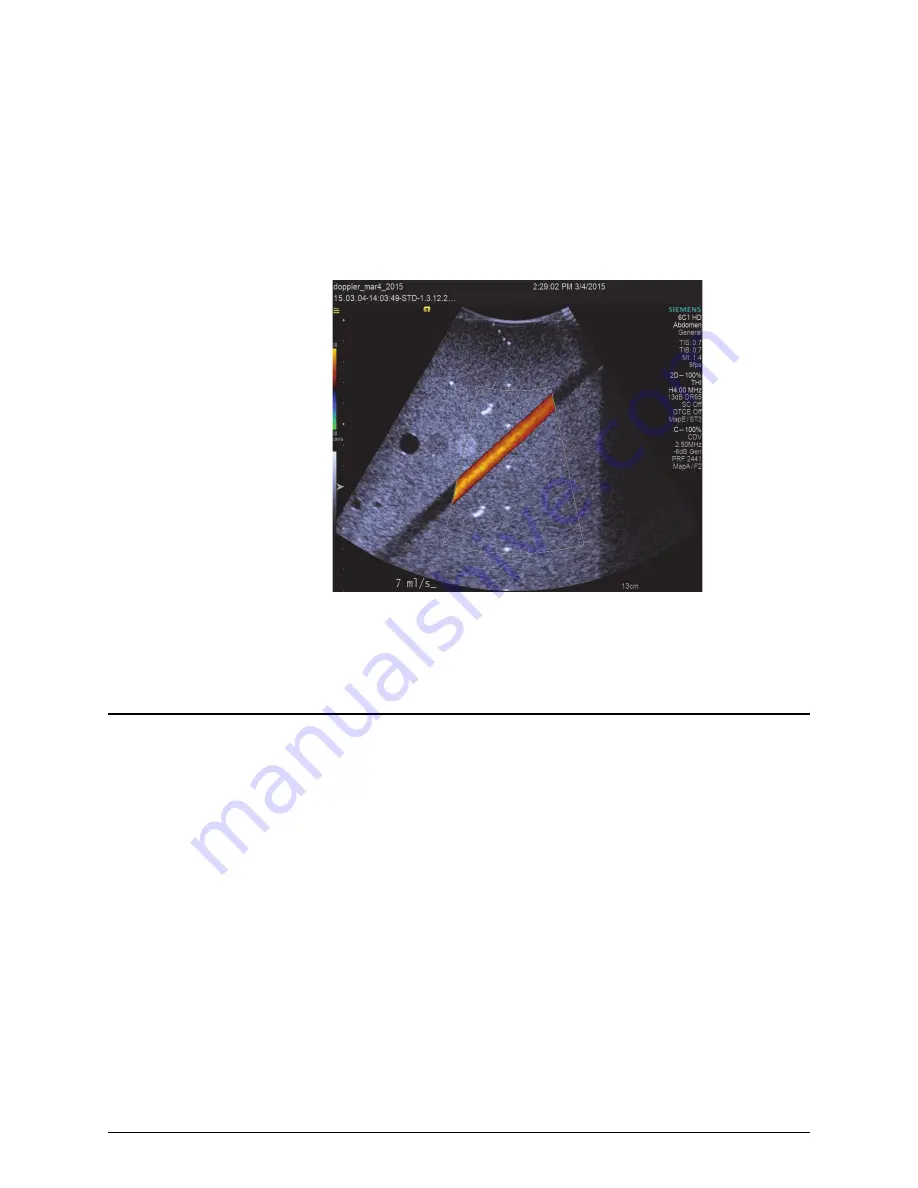
Toggle between color flow and B-mode. 

a.  

Observe whether the color flow information is displayed only within the vessel. 

b.  

Record scanner settings that produce poor correlation. 

c.  

Note whether the highest flow rate occurs at the vessel’s center and the lowest flow rate at 

the vessel wall.

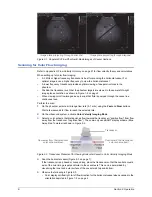
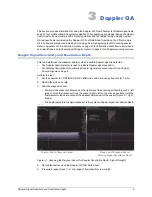
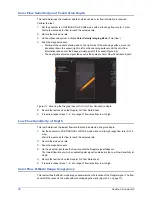
Figure 3-3. Scanning the Diagonal Vessel for Color Flow and B-Mode Image Correlation

6

Record the results on the Doppler QC Test Data sheet.

7

If required, repeat step

1

 - 

6

 at a range of flow rates from low to high.

Directional Discrimination

The Directional Discrimination test evaluates the scanner’s ability to accurately display flow 
direction.
With the beam perpendicular to the flow, Doppler signals and the spectral broadening artifact should 
be equally positive and negative, and the magnitude of the signals should be the same. 
Perform the test:

1

Set the phantom to CONTINUOUS mode and set the flow rate to produce a laminar flow, at a 
flow rate low enough that aliasing does not occur. 

2

Record the mode and rate.

3

Scan the horizontal vessel. 
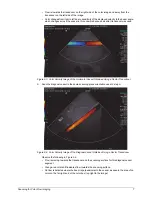
Place the transducer so that the beam is perpendicular to the vessel axis (Figure 3-4 on page 
12).
The spectral display should be equally positive and negative, mirroring across the baseline.

Summary of Contents for 1425B

Page 1: ...Title Doppler 403TM Flow Phantom Model 1425B...

Page 2: ...ed Gammex Inc reserves the right to make periodic modifications to this manual without obligation to notify any person or entity of such revision This guide is written for Model 1425B Doppler 403 Flow...

Page 3: ...I device in accordance with the Medical Device Directive 93 42 EEC Annex VII Gammex Class I medical products are listed in Europe with the Competent Authority of Germany Health and Safety Instructions...

Page 4: ...latest product information and product updates Document Conventions Bold typeface indicates a button name or something that the user must type Italicized typeface indicates the title of a manual a cro...

Page 5: ...Transducer Integrity 16 Distance Measurement Accuracy 17 Lateral and Axial Resolution and Image Geometry 18 Gray Scale Display 20 Qualitative 20 Quantitative 21 Baseline Test 21 Subsequent Tests 21 D...

Page 6: ...vi Contents This page is intentionally left blank...

Page 7: ...ng modes and technology including a non adipose tissue B A value and frequency dependent attenuation As a flow phantom the Doppler 403 consists of a low echogenicity fluid flow system and an electroni...

Page 8: ...E Gel The HE High Equivalence Gel is a patented tissue mimicking material that makes up the phantom background The HE Gel has the acoustic properties of human tissue with a sound speed of 1540 10 m s...

Page 9: ...the water dam with distilled water to optimize transducer coupling Clean all scanning gel from the phantom s surface using distilled water and a soft fabric or paper towel following the instructions...

Page 10: ...when flow controller pump is on On steady Operating in CONTINUOUS mode Blinking Operating in PULSE mode 4 On Off switch Activates pump in CONTINUOUS mode and provides power to flow controller pump Fi...

Page 11: ...Transducer Holder User s Guide for complete instructions Scanning Using an Abdominal Transducer 1 Place abdominal transducer on scanning surface and adjust scanner s depth setting and gain controls to...

Page 12: ...r flow to reach the selected rate 2 On the ultrasound system activate Color Velocity Imaging Mode 3 Select a color scheme that distinguishes flow towards the transducer positive flow from flow away fr...

Page 13: ...Horizontal Vessel Obtained Using a Sector Transducer 6 Scan the diagonal vessel in the same scanning plane orientation used in step 4 Figure 2 4 Color Velocity Image of the Diagonal Vessel Obtained Us...

Page 14: ...enerate another spectral Doppler signal as shown in Figure 2 6 Figure 2 5 Doppler Spectral Display of Horizontal Vessel Beam Steering Continuous Flow Observe the following in Figure 2 5 Flow direction...

Page 15: ...tected The Doppler spectral display is used to indicate Doppler signal sensitivity For additional instructions for performing Doppler signal procedures refer to Scanning with Doppler Signals on page 8...

Page 16: ...ssel for Color Flow Penetration Depth 5 Record the test result on the Doppler QC Test Data Sheet 6 If required repeat steps 1 5 at a range of flow rates from low to high Low Flow Sensitivity at Depth...

Page 17: ...6 Record the results on the Doppler QC Test Data sheet 7 If required repeat steps 1 6 at a range of flow rates from low to high Directional Discrimination The Directional Discrimination test evaluates...

Page 18: ...inside a tube from near zero at the wall to higher values inside the tube Refer to Appendix A Flow Velocity Accuracy on page 27 If the velocity profile inside the tube is parabolic then the peak veloc...

Page 19: ...itioned on the far left side of the scanning surface In the diagonal vessel parabolic flow is achieved at all flow rates The diagonal vessel is approximately 30 longer than the horizontal vessel Refer...

Page 20: ...olume cursor indicates the region in the imaged volume from which Doppler information is collected for analysis The Sample Gate Positioning test evaluates the accuracy of the cursor s location in the...

Page 21: ...s possible a Set transmit power to maximum 100 b Adjust transmit focus to maximum depth or near maximum depth c Increase receiver gain 2 Record the transducer power focus and gain settings on the B Mo...

Page 22: ...from the transducer surface and projecting onto the image Many labs use a graded assessment of the transducer when interpreting the results For example a No evidence of dropout b 1 or 2 slight shadows...

Page 23: ...and Horizontal Distance Measurement Tests 2 Use the electronic calipers to measure the distance between any two vertical pin targets and record the measurement 3 Compare with the known 2 cm distance...

Page 24: ...ound 1540 m s pin targets appear as sharp points and the 2 mm anechoic cylinder is clearly visible and highly resolved Figure 4 5 Lateral Resolution Quality Differences Due to Speed of Sound Settings...

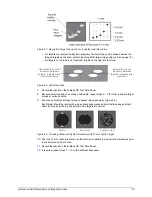
Page 25: ...roups at various depths 9 Scan the nearest cystic target group to assess image geometry Figure 4 9 Each target should be round with a clean black appearance and well defined edges Bright specular echo...

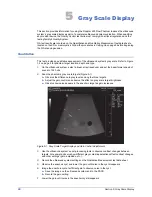
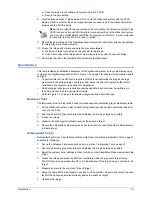
Page 26: ...rray transducer and set the beamformer speed of sound to 1540 m s 2 Scan the phantom s gray scale targets Figure 5 1 a Observe the difference in gray levels among the three targets b Adjust the gain c...

Page 27: ...from this test will be used for all subsequent quantitative gray scale display tests 1 On the ultrasound system select a linear array transducer and set the beamformer speed of sound to 1540 m s 2 Sca...

Page 28: ...ation Figure 5 2 right 5 Note the gain values displayed by the ultrasound system 6 In the active image adjust the gain until the target gray level in the left image matches the background gray level i...

Page 29: ...d in suspension Store the power supply and cord in the pouch provided Never store the power supply directly on the phantom as doing so could damage the scanning surface Weighing The phantom s backgrou...

Page 30: ...Support Parts Accessories can be ordered from the Gammex Sales department Telephone 1 608 828 7000 Disposal and Recycling The phantom contains electrical components In some countries the disposal of...

Page 31: ...ontal 1 diagonal Position cm 0 3 Horizontal 2 0 below scanning surface Diagonal From 2 0 below scanning surface at wall to 16 0 at 40 Inside diameter mm 0 2 5 0 Material density g cm3 1 01 Scanning su...

Page 32: ...02 6 and 6 dB same as background Anechoic 0 05 Speed of sound m s 10 1540 Power Battery type Rechargeable Li Ion 14 8V Battery rating 2200 mA h minimum 35 5 W h Mains supply 100 240V AC Device input 1...

Page 33: ...the velocity profile at the measurement location The volume flow rate can be represented by an average velocity vmean across the vessel area For circular vessels the calculation is where D is the ins...

Page 34: ...e Doppler 403 Flow Phantom up to 122 cm s Mean and Maximum Velocity Calculations Many ultrasound systems display velocity estimates on the spectral display The notations TAMEAN and TAMAX are often use...

Page 35: ...achieve fully developed parabolic flow is directly proportional to the speed and therefore to the flow rate Table 3 1 on page 13 provides the calculations for entrance length L to realize parabolic fl...

Page 36: ...rapher It is important to understand that TAMEAN is the average velocity in the sample volume established both by the Doppler range gate and by the ultrasound beam width Because the sample volume may...

Page 37: ...locity An important influence on estimated velocity is the Doppler angle which is established by the direction of the beam and the direction of reflectors over the beam In most situations an angle cor...

Page 38: ...32 Appendix A Flow Velocity Accuracy Figure A 9 Beam Geometry and Displayed Velocity Vessel Depth Effect...

Page 39: ...h than if the reception had been at the fundamental frequency One way in which image quality is improved using harmonics is through the reduction of reverberations and unwanted clutter Figure B 1 left...

Page 40: ...penetration Figure B 3 Fundamental Imaging left and Harmonic Imaging right Figure B 4 shows the improved resolution seen in harmonic imaging of the phantom s pin targets nylon fibers The fibers appea...

Page 41: ...e not accurate these features may not be represented consistently Ultrasound systems use special processing algorithms to translate the amplitude of echoes into brightness levels on the system display...

Page 42: ...the information displayed may affect the interpretation of the ultrasound image Notice how the positions of the original brightness levels B Bo and B seen in Figure B 5 on page 35 have moved to B 1 Bo...

Page 43: ...its Journal of Ultrasound in Medicine 14 pp 273 277 6 Hendrick W R 1995 Quality Control and Acceptance Testing In W R Hendrick S D L Hykes D E Starchman Ed Ultrasound Physics and Instrumentation 3rd E...

Page 44: ...38 Appendix C Additional Reading This page is intentionally left blank...

Page 45: ...setup and use of the of the phantom WARNING This symbol indicates a risk of electric shock WARNING This symbol indicates a hazard that could result in major injury or equipment damage CAUTION This sy...

Page 46: ...Gammex s Authorized European Representative is Modifications to Equipment Interaction with Other Electrical Equipment EMC Precautions The instrument complies with IEC 60601 1 2 Electromagnetic Perform...

Page 47: ...of the defect and d which are found to be defective by Seller upon Seller s examination Buyer shall pay all transportation charges Products manufactured by third parties must be returned to Seller wit...

Page 48: ...RUSRUDWH HDGTXDUWHUV LVFRYHU ULYH 0LGGOHWRQ 86 VXQQXFOHDU FRP...

Reviews: