18
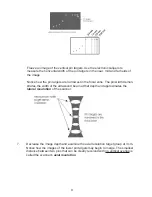
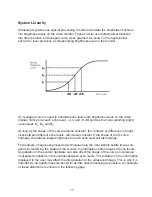
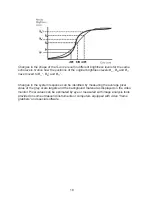
Changes in the shape of the S-curve result in different brightness levels for the same
echo levels. Notice how the positions of the original brightness levels B–, Bo and B+
have moved to B–
1
, Bo
1
and B+
1
.
Changes in the system response can be identified by measuring the average pixel
value of the grey scale targets and the background material as displayed on the video
monitor. Pixel values can be estimated by eye or measured with image analysis tools
provided on some ultrasound instruments or computers equipped with video “frame
grabbers” and special software.
Summary of Contents for 405 GSX LE
Page 1: ...User s Guide 405 GSX LE Precision Resolution Grey Scale Phantom ...
Page 13: ...13 ...
Page 25: ...25 Notes ...

