20
Section 5. Gray Scale Display
5
Gray Scale Display
This section provides information for using the Doppler 403 Flow Phantom to asses the ultrasound
system’s gray scale display as part of a complete ultrasound system evaluation. When qualifying
any medical device, the Quality Control test suite must comply with all local regulations and the
testing facility’s Quality System.
QA test results are recorded on the Quantitative and Qualitative Measurement test data sheets,
located on the CD or memory stick. Follow the procedures in
on page 5 before beginning
the QA scanning session.
Qualitative
This test provides a qualitative assessment of the ultrasound system’s gray scale. Refer to Figure
1-2 on page 2 for phantom target location, depth and type.
1
On the ultrasound system, select a linear array transducer and set the beamformer speed of
sound to 1540 m/s.
2
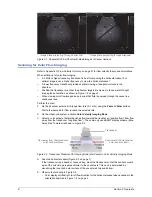
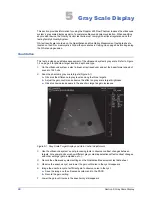
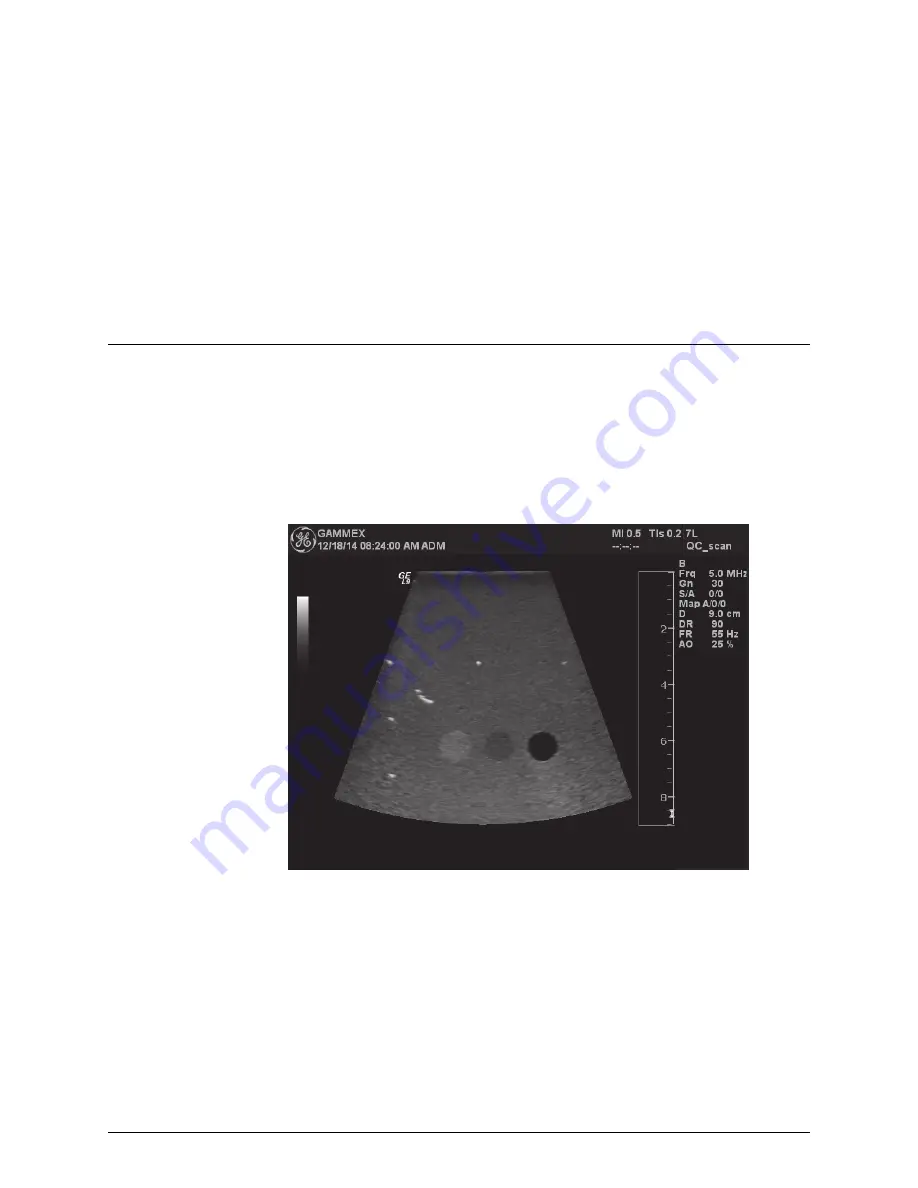
Scan the phantom’s gray scale targets (Figure 5-1).
a.
Observe the difference in gray levels among the three targets.
b.
Adjust the gain control and observe the effect on gray scale target brightness.
c.
Observe how noise appears in the anechoic target as gain increases.
Figure 5-1. Gray Scale Target Display and Gain Control Adjustments
3
Use the ultrasound system’s post-processing tools to observe contrast changes between
targets. For example, observe how different gray scale map selections affect contrast changes.
and other settings (gain, amplitude, etc.).
4
Record the ultrasound system settings on the Qualitative Measurement test data sheet.
5
Observe the anechoic cyst and lower the gain until noise in the cyst disappears.
6
Image the anechoic cyst at sufficient gain to observe noise in the cyst.
a.
Save the image on the ultrasound system and to the PACS.
b.
Record the gain setting.
7
Lower the gain until noise in the anechoic cyst disappears.

