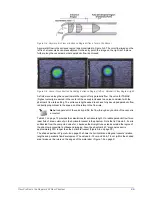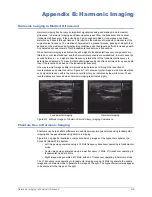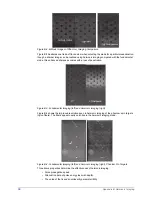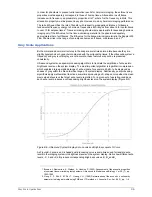
Quantitative
21
a.
Save the image to the ultrasound system and to the PACS.
b.
Record the gain setting.
8
View the images saved in steps
and
on both the ultrasound system and the PACS
display. Observe whether the same image features are seen on both the ultrasound system
images and the PACS display.
9
Record the gain settings on the Qualitative Measurement test data sheet and use the settings
for future gray scale measurements.
10
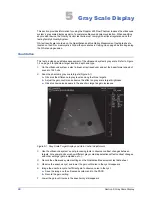
Freeze the image and visually evaluate the gray scale targets.
a.
Match each target with a step on the gray bar in the image.
b.
Print a hard copy of the image and compare the hard copy with the scanner image.
11
Record the results on the Qualitative Measurement test data sheet.
Quantitative
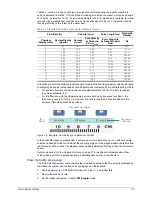
This test provides a quantitative assessment of the ultrasound system’s gray scale display using
comparisons of digital image data. Refer to Figure 1-2 on page 2 for phantom target location, depth
and type.
•
To perform this test, an ROI tool is required. ROI tools can determine the image’s average
pixel value in the defined region of interest, and reduce the effect of speckle so that small
variations in the targets can be used for comparisons.
•
Good scanning technique is required to obtain good data. Each test must be performed in
the same manner to obtain optimal test results.
•
Refer to Figure 1-2 on page 2 for phantom target location, depth and type.
Baseline Test
The information from this test will be used for all subsequent quantitative gray scale display tests.
1
On the ultrasound system, select a linear array transducer and set the beamformer speed of
sound to 1540 m/s.
2
Scan the phantom’s gray scale targets and display the image as large as possible.
3
Freeze the image.
4
Measure the echo level (brightness level) of the anechoic target.
5
Record the ultrasound system setup and echo level results on the Quantitative Measurement
test data sheet.
Subsequent Tests
Before starting this test, have the Quantitative Data Sheet completed in
available for reference.
1
Set up the ultrasound system exactly as set up in step
2
Scan the phantom’s gray scale targets and display the image as large as possible.
3
Adjust the system control settings to those recorded on the Quantitative Measurement test data
sheet.
4
Freeze the image and place the ROI tool completely inside the gray scale target image.
The ROI should be approximately 2/3 to 3/4 the diameter of the target image, centered in the
target.
5
Measure and record the echo level of each target.
6
Using the same ROI as the target (or as close to it as possible), measure and record the echo
level of the background material directly beside the anechoic target.
7
Unfreeze the image.
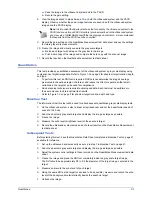
Note:
It is important that low level echoes that are sent by the ultrasound system to the
PACS (and are visible on PACS monitors) also be visualized on the ultrasound system,
and vice versa. [AIUM QA Manual] If the two displays do not match, it is recommended
that experts from the PACS team be consulted.

