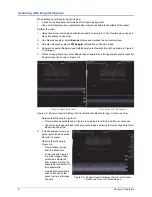
22
Section 5. Gray Scale Display
8
Repeat steps
three times.
9
Record the average echo level for each gray scale target and for the background material on
the Quantitative Measurement test data sheet.
Dual Display Analysis
This test provides a qualitative assessment of the ultrasound system’s gray scale display using the
dual mode display available on some ultrasound systems. Refer to Figure 1-2 on page 2 for
phantom target location, depth and type.
1
On the ultrasound system, activate the Left and Right displayed images.
2
On the active image, left, scan one of the gray scale objects.
3
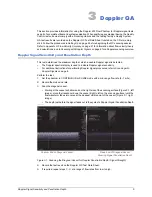
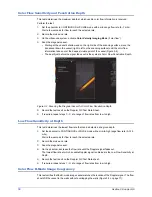
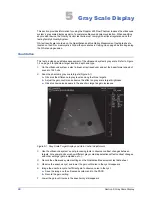
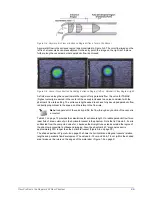
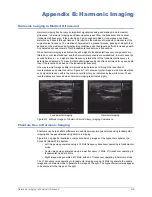
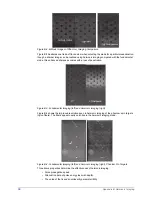
Use the zoom function to locate the target at one side of the image (Figure 5-2, left).
4
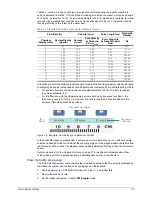
Activate the dual mode for the second image, right, scan the same region and target identified
in step
, and zoom to the same location (Figure 5-2, right).
5
Note the gain values displayed by the ultrasound system.
6
In the active image, adjust the gain until the target gray level in the left image matches the
background gray level in the right image (Figure 5-2).
Figure 5-2. Gray Scale Comparison Using Dual Display
If the gain is calibrated in decibels, the difference between the two gain values represents the
gray scale value in dB.
Figure 5-2 shows the same gray scale target on each display, but note:
• The gain values are 48 dB in the left image, and 42 dB in the right image.
• The overall brightness of the background region on the right image matches the brightness
of the target in the left image, taken with 6 dB higher gain.
The difference in gain values means the gray scale target has a -6 dB contrast relative to
the background.
7
Record the results on the Qualitative Measurement test data sheet.
8
If required, repeat steps
for each gray scale target.
Left image gray scale target
Right image background matches left image target

