12
Introduction
NOTE
: Vessels being tracked with the Blue
Force Tracking feature are indicated with a
blue-green color regardless of their status.
Heading and Projected Course of Acti-
vated AIS Targets
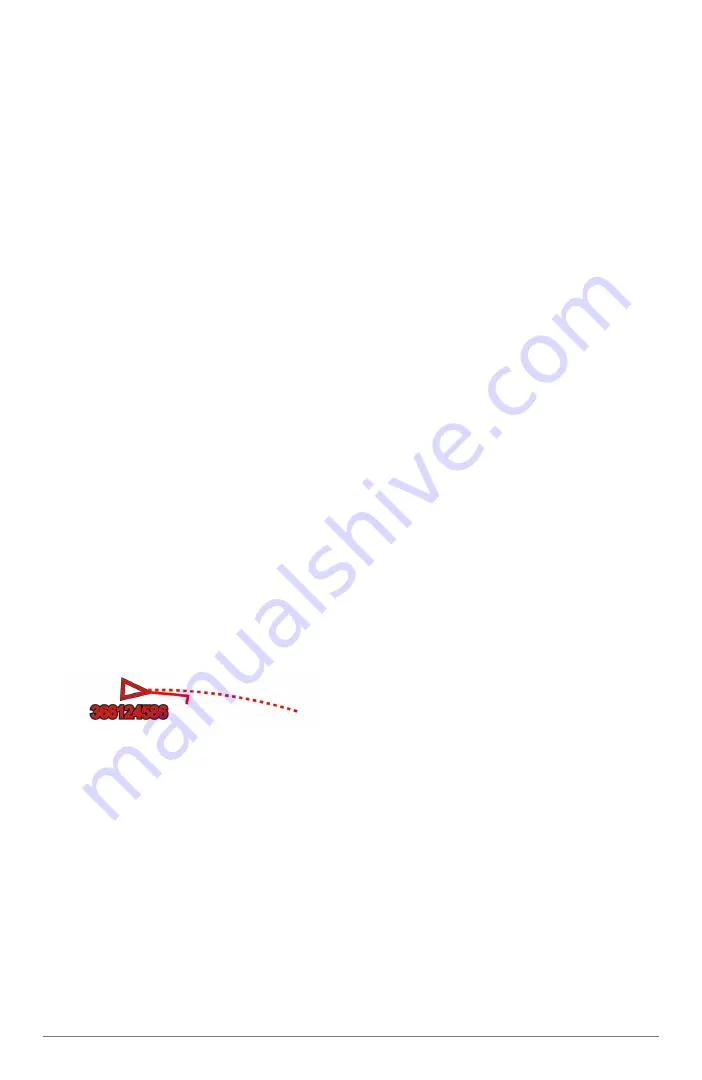
When heading and course over ground
information are provided by an activated AIS
target, the heading of the target appears on
a chart as a solid line attached to the AIS tar-
get symbol. A heading line does not appear
on a 3D chart view.
The projected course of an activated AIS
target appears as a dashed line on a chart
or a 3D chart view. The length of the project-
ed course line is based on the value of the
projected heading setting. If an activated AIS
target is not transmitting speed information,
or if the vessel is not moving, a projected
course line does not appear. Changes in
the speed, course over ground, or rate of
turn information transmitted by the vessel
can impact the calculation of the projected
course line.
When course over ground, heading, and rate
of turn information are provided by an acti-
vated AIS target, the projected course of the
target is calculated based on the course over
ground and the rate of turn information. The
direction in which the target is turning, which
is also based on the rate of turn information,
is indicated by the direction of the barb at
the end of the heading line. The length of the
barb does not change.
When course over ground and heading
information are provided by an activated AIS
target, but rate of turn information is not pro-
vided, the projected course of the target is
calculated based on the course over ground
information.
Showing AIS Vessels on a Chart or 3D
Chart View
Before you can use AIS, you must connect
the chartplotter to an external AIS device and
receive active transponder signals from other
vessels.
You can configure how other vessels appear
on a chart or on a 3D chart view. The display
range configured for one chart or one 3D
chart view are applied only to that chart or
to that 3D chart view. The details, projected
heading, and trails settings configured for
one chart or one 3D chart view are applied to
all charts and to all 3D chart views.
1
From a chart or 3D chart view, select
MENU
>
Other Vessels
>
AIS Display
Setup
.
2
Select an option:
•
To indicate the distance from your
location in which AIS vessels appear,
select
AIS Display Range
, and select a
distance.
•
To show details about AIS-activated
vessels,select
Details
>
Show
.
•
To set the projected heading time for
AIS-activated vessels, select
Projected
Heading
, and enter the time.
•
To show the tracks of AIS vessels, se-
lect
Trails
, and select the length of the
track that appears using a trail.
Activating a Target for an AIS Vessel
1
From a chart or a 3D chart view, select an
AIS vessel.
2
Select
AIS Vessel
>
Activate Target
.
Viewing Information about a Targeted AIS
Vessel
You can view the AIS signal status, MMSI,
GPS speed, GPS heading, and other infor-
mation that is reported about a targeted AIS
vessel.
1
From a chart or a 3D chart view, select an
AIS vessel.
2
Select
AIS Vessel
.
Deactivating a Target for an AIS Vessel
1
From a chart or a 3D chart view, select an
AIS vessel.
2
Select
AIS Vessel
>
Deactivate Target
.
Viewing a List of AIS Threats
From a chart or 3D chart view, select
MENU
> Other Vessels > AIS List.
Setting the Safe-Zone Collision Alarm
Before you can set a safe-zone collision
alarm, you must have a compatible chartplot-
ter connected to an AIS device.
The safe-zone collision alarm is used only
with AIS. The safe zone is used for collision
avoidance, and can be customized.
1
Select
Settings
>
Alarms
>
AIS
>
AIS


