background image

10

Introduction

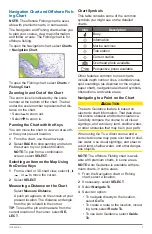
Showing Satellite Imagery on the Navi-

gation Chart

NOTE

: This feature is available with premium 

charts, in some areas.
You can overlay high-resolution satellite 

images on the land or on both land and sea 

portions of the Navigation chart.

NOTE

: When enabled, high-resolution sat-

ellite images are present only at lower zoom 

levels. If you cannot see high- resolution 

images in your optional chart region, you 

can select   to zoom in. You also can set 

the detail level higher by changing the map 

zoom detail.

1

  From the Navigation chart, select 

MENU


Chart Setup

 > 

Satellite Photos

.

2

  Select an option:

• 

 Select Land Only to show standard 

chart information on the water, with 

photos overlaying the land.

• 

 Select Photo Map Blend to show pho-

tos on both the water and the land at 

a specified opacity. Use the slider bar 

to adjust the photo opacity. The higher 

you set the percentage, the more the 

satellite photos cover both land and 

water.

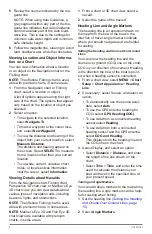
Viewing Aerial Photos of Landmarks

Before you can view aerial photos on the 

Navigation chart, you must turn on the Photo 

setting in the chart setup.

NOTE

: This feature is available with premium 

charts, in some areas.
You can use aerial photographs of land-

marks, marinas, and harbors to help orient 

yourself to your surroundings or to acquaint 

yourself with a marina or a harbor prior to 

arrival.

1

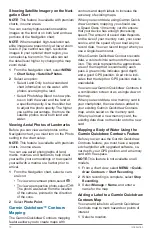
  From the Navigation chart, select a cam-

era icon:

• 

 To view an overhead photo,select   .

• 

 To view a perspective photo,select 


The photo was taken from the location 

of the camera, pointed in the direction 

of the cone.

2

 Select 

Photo Point

.

Garmin Quickdraw™ Contours 

Mapping

The Garmin Quickdraw Contours mapping 

feature allows you to create maps with 

contours and depth labels to increase the 

accuracy of existing maps.
When you record data using Garmin Quick-

draw Contours mapping, you should use 

a Speed Class 10 memory card to ensure 

that your device has enough processing 

speed. The amount of saved data depends 

on the size of your memory card, your sonar 

source, and the speed of your boat as you 

record data. You can record longer when you 

use a single-beam sonar.
When Garmin Quickdraw Contours records 

data, a colored circle surrounds the vessel 

icon. This circle represents the approximate 

area of the map that is scanned by each 

pass. A green circle indicates good depth 

and a good GPS position. A red circle indi-

cates that the depth or GPS position data is 

unavailable.
You can view Garmin Quickdraw Contours in 

a combination screen or as a single view on 

the map.
When you record data on a memory card in 

your chartplotter, the new data is added to 

your existing Garmin Quickdraw Contours 

map, and is saved on the memory card. 

When you insert a new memory card, the 

existing data does not transfer onto the new 

card.

Mapping a Body of Water Using the 

Garmin Quickdraw Contours Feature

Before you can use the Garmin Quickdraw 

Contours feature, you must have a support-

ed chartplotter with upgraded software, so-

nar depth, your GPS position, and a memory 

card with free space.

NOTE

: This feature is not available on all 

models.

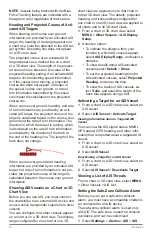
1

  From a chart view, select 

MENU

 > 

Quick-

draw Contours

 > 

Start Recording

.

2

  When recording is complete, select 

Stop 

Recording

.

3

 Select 

Manage

 > 

Name

, and enter a 

name for the map.

Adding a Label to a Garmin Quickdraw 

Contours Map

You can add labels to a Garmin Quickdraw 

Contours map to mark hazards or points of 

interest.

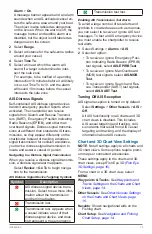
1

  Select a location.

Summary of Contents for echoMAP CHIRP 45 Series

Page 1: ...Owner s Manual echoMAP CHIRP 45 55 75 95 Series...

Page 2: ...n and Fishing Chart Setup 14 Waypoints and Tracks Settings on the Charts and Chart Views 14 Overlay Numbers Settings 14 Showing a Navigation Inset 15 Chart Appearance Settings 15 Setting the Heading a...

Page 3: ...etail 30 Adjusting the Color Intensity 30 Adjusting the Range of the Depth or Width Scale 30 Setting the Zoom Level on the Sonar Screen 31 Setting the Scroll Speed 31 Sonar Frequencies 31 Selecting Fr...

Page 4: ...the Water Temperature Offset 39 Calibrating a Water Speed Device 40 Setting the Fuel Capacity of the Vessel 40 Synchronizing the Fuel Data with the Actual Vessel Fuel 40 Customizing Engine Gauge and F...

Page 5: ...ght sensor Device Keys Turns on and off the device when held Adjusts the backlight and color mode when quickly pressed and released Zooms out of a chart or view Zooms in to a chart or view Scrolls hig...

Page 6: ...to Garmin com support software ma rine html 3 Select Download next to echo MAP Se ries with SD Card 4 Read and agree to the terms 5 Select Download 6 Select Run 7 Select the drive associated with the...

Page 7: ...h soundings marinas and tide stations in an over head view Perspective 3D Provides a view from above and behind the boat according to your course and provides a visual navigation aid This view is help...

Page 8: ...in and measure from the current location of the cursor select SE LECT Chart Symbols This table contains some of the common symbols you might see on the detailed charts Icon Description Buoy Informatio...

Page 9: ...acons lights and obstructions NOTE The offshore Fishing chart is avail able with premium charts in some areas NOTE Mariner s Eye 3D and Fish Eye 3D chart views are available with premium charts in som...

Page 10: ...s a tide station You can view a detailed graph for a tide station to help predict the tide level at different times or on different days NOTE This feature is available with premium charts in some area...

Page 11: ...ng The Garmin Quickdraw Contours mapping feature allows you to create maps with contours and depth labels to increase the accuracy of existing maps When you record data using Garmin Quick draw Contour...

Page 12: ...otter with a blue green color AIS Targeting Symbols Symbol Description AIS vessel The vessel is report ing AIS information The direction in which the triangle is pointing indicates the direction in wh...

Page 13: ...ct the chartplotter to an external AIS device and receive active transponder signals from other vessels You can configure how other vessels appear on a chart or on a 3D chart view The display range co...

Page 14: ...ssion Select to see more infor mation about the transmission and begin navigation Transmission lost Transmission test Appears when a vessel initiates a test of their distress signal device and does no...

Page 15: ...erlay Numbers See Overlay Numbers Settings page 14 Weather Sets which weather items are shown on the chart when the chartplotter is connected to a compatible weather receiver with an active subscripti...

Page 16: ...tem AHRS must be calibrated use this feature Transducer Installation Set tings page 29 World Map Uses either a basic world map or a shaded relief map on the chart These differences are visible only wh...

Page 17: ...ion within which AIS ves sels appear Details Shows details about AIS activated vessels Projected Heading Sets the projected heading time for AIS activated vessels Trails Shows the tracks of AIS vessel...

Page 18: ...do I make the chartplotter point me in the direction in which I want to go bearing Navigate using Go To See Set ting and Fol lowing a Direct Course Using Go To page 19 How do I make the device guide m...

Page 19: ...water Use visual sightings and steer to avoid land shallow water and other danger ous objects NOTE Auto Guidance is available with pre mium charts in some areas CAUTION Garmin recommends using Guide T...

Page 20: ...ypoint 2 Select an option To create the waypoint by entering po sition coordinates select Enter Coordi nates and enter the coordinates To create the waypoint using a chart select Route Using Chart sel...

Page 21: ...ecessary repeat step 3 and 4 to add additional turns working backward from the destination to the present location of your vessel The last turn you add should be the first turn you make starting from...

Page 22: ...desti nation point used when the route was created to the left of the original route select Backward Port To navigate the route from the destina tion point used when the route was cre ated to the rig...

Page 23: ...ive Track The track currently being recorded is called the active track 1 Select User Data Tracks Follow Active Track 2 Select an option Select the time the active track began Select Entire Log 3 Revi...

Page 24: ...Select Navigation Routes Auto Guidance Paths New Auto Guid ance 2 Select SELECT and choose a destina tion point Filtering a List of Routes and Auto Guidance Paths You can filter a list of routes and...

Page 25: ...Auto Guidance line is too close to known obstacles select Settings Navigation Auto Guidance Shore line Distance Farthest If the turns in the Auto Guidance line are too wide select Settings Navi gatio...

Page 26: ...y Options Distance Bearing Allows you to hide or display the bearing and distance to your destination for the active boundary Chart Display Allows you to hide or display boundaries on the chart Color...

Page 27: ...Power Saver You can adjust the level of rudder activity 1 From the autopilot screen select MENU Autopilot Setup Power Mode Setup Power Saver 2 Select a percentage Selecting a higher percentage reduce...

Page 28: ...mbers shown on the screen select Overlay Numbers To change the data shown in the com bination select the screen to change and select the new data To resize the windows drag the arrows Adding a Custom...

Page 29: ...lies to the sides of the boat You can use this as a search tool to find structures and fish 1 Left side of the boat 2 Right side of the boat 3 The transducer on your vessel 4 Trees 5 Old tires 6 Logs...

Page 30: ...ransmit Power Reduces transducer ringing near the surface A lower transmit power value reduces transducer ringing but can also reduce the strength of the returns Filter Width Defines the edges of the...

Page 31: ...To allow the chartplotter to adjust the gain or brightness automatically select an automatic option Adjusting the Color Intensity You can adjust the intensity of colors and highlight areas of interest...

Page 32: ...ar views it is recommend to use the Auto setting To use a very fast scroll speed select Ultrascroll The Ultrascroll option quickly scrolls new sonar data but with a reduced image quality For most situ...

Page 33: ...ntrast color schemes pro vide darker color assignments to the low intensity returns The low contrast color schemes provide color assignments to the low intensity returns that are similar to the backgr...

Page 34: ...ns making them ideal for locating fish Wider beam widths also perform better in deep water because the lower frequency has better deep water penetration Wider beam widths can also generate more surfac...

Page 35: ...o select Reset Odometer To set all the readings to zero select Reset All Tide Current and Celestial Informa tion Tide Station Information You can view information about a tide station for a specific d...

Page 36: ...ther Vessels DSC List Adding a DSC Contact You can add a vessel to your DSC list You can make calls to a DSC contact from the chartplotter 1 Select Navigation Info Other Vessels DSC List Add Contact 2...

Page 37: ...m a chart or 3D chart view select MENU Other Vessels DSC Trails 2 Select the number of hours to show tracked vessels on the chart For example if you select 4 Hours all trail points that are less than...

Page 38: ...enter a name The file name is saved with an adm extension To add the information to an existing file select the file from the list Selecting a File Type for Third Party Waypoints and Routes You can i...

Page 39: ...ite settings and fix Auto Power Turns on the device automat ically when power is applied Turning On the Chartplotter Automatically page 38 Language Sets the on screen text lan guage Speed Sources Sets...

Page 40: ...g the Fuel Data with the Actual Vessel Fuel page 40 Set Gauge Limits Sets the upper and lower limits of various gauges Customizing Engine Gauge and Fuel Gauge Limits page 40 Setting the Keel Offset Yo...

Page 41: ...synchronize the fuel levels in the chartplotter with the actual fuel in the vessel when you add fuel to your vessel 1 Select Navigation Info Engine MENU 2 Select an option After you have filled up all...

Page 42: ...ystem information Garmin Enables NMEA 0183 output sen tences for Garmin proprietary sentences Posn Precision Adjusts the number of digits to the right of the decimal point for trans mission of NMEA ou...

Page 43: ...n improve autopilot accuracy Turn Transition Dist Sets how far before the turn that you transition to it as the next leg when Distance is selected for the Turn Transition Activ You can raise this valu...

Page 44: ...power You can check this several ways For ex ample you can check whether other devic es powered by the source are functioning Check the fuse in the power cable The fuse should be located in a holder t...

Page 45: ...0 saved tracks 50 000 Active Track point Dual freuency so nar 50 200kHz YES Dual beam sonar 77 200kHz YES Frequencies sup ported CHIRP low medium high Traditional 50 77 200 kHz DownV 260 455 800 kHz S...

Page 46: ...ation GPXTE XTE Cross track error PGRME E Estimated error PGRMM M Map datum PGRMZ Z Altitude SDDBT DBT Depth below transducer SDDPT DPT Depth SDMTW MTW Water tem perature SDVHW VHW Water speed and hea...

Page 47: ...s track error 129284 Navigation data 129285 Navigation route and waypoint info 129540 GNSS satellites in view Receive 127245 Rudder 127250 Vessel heading 127488 Engine parameters Rapid update 127489 E...

Page 48: ...and is protected under the Unit ed States of America copyright laws and international copyright treaties You further acknowledge that the structure organiza tion and code of the Software for which so...

Page 49: ...r its subsidiaries Garmin International Inc 1200 East 151st Street Olathe Kansas 66062 USA Garmin Corporation No 68 Zhangshu 2nd Road Xizhi Dist New Taipei City 221 Taiwan Garmin com Garmin com cn Gar...

Reviews: