


Color
Marine Weather Group
Red
Marine
Yellow
Severe Storm
Red
Tornado
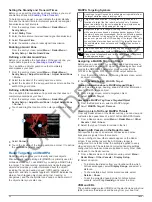
Forecast Information
The Forecast chart shows city forecasts, marine forecasts,
warnings, hurricane warnings, METARS, county warnings,
weather fronts and pressure centers, surface pressure, and
weather buoys.
Viewing Forecast Information for Another Time Period
1
Select
Charts
>
Forecast
.
2
Select an option:
• To view the weather forecast for the next 48 hours, in 12-
hour increments, select
Next Forecast
multiple times.
• To view the weather forecast for the previous 48 hours, in
12-hour increments, select
Previous Forecast
multiple
times.
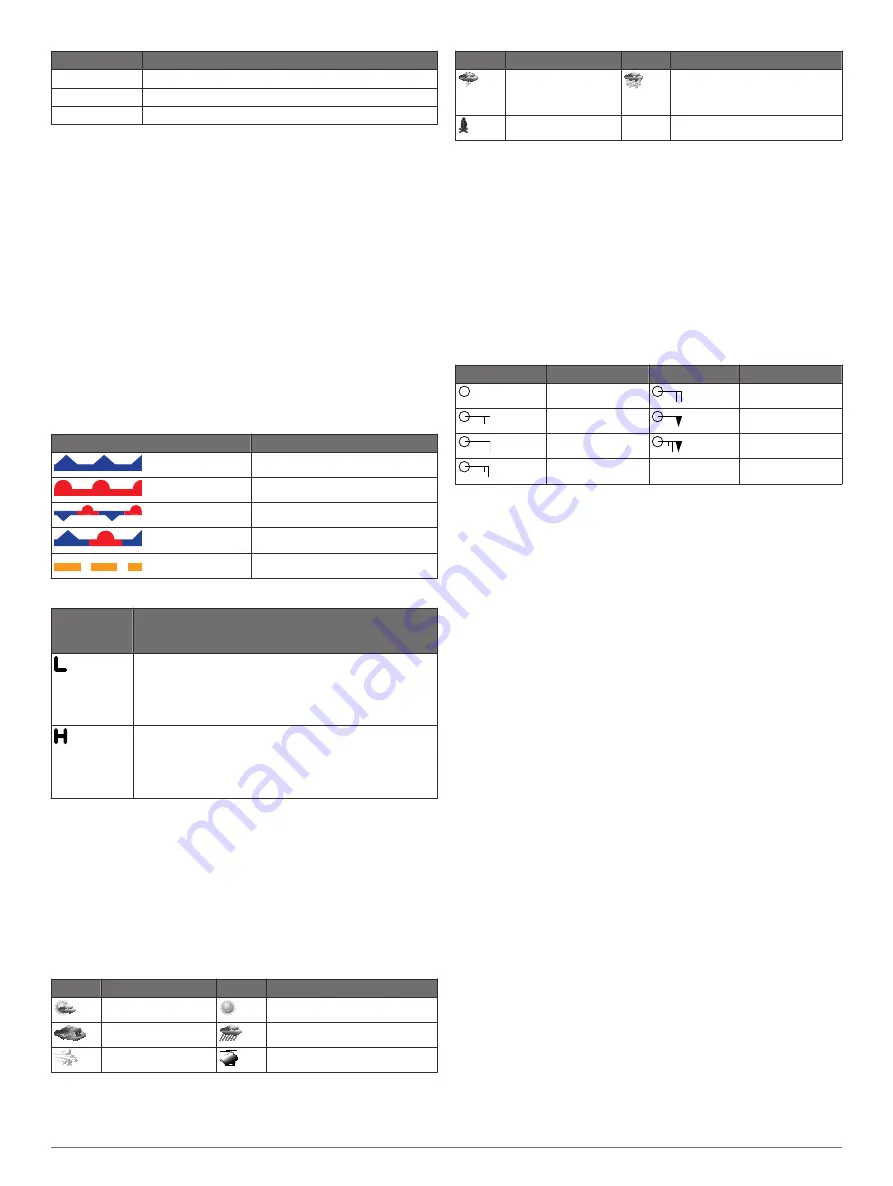
Weather Fronts and Pressure Centers
Weather fronts appear as lines that indicate the leading edge of
an air mass.
Front Symbol
Description
Cold front
Warm front
Stationary front
Occluded front
Trough
Pressure-center symbols often appear near weather fronts.
Pressure-
Center
Symbol
Description
Indicates a low-pressure center, which is a region of
relatively lower pressure. Moving away from a low-
pressure center results in increased pressure. Winds
flow counterclockwise around low-pressure centers in
the northern hemisphere.
Indicates a high-pressure center, which is a region of
relatively higher pressure. Moving away from a high-
pressure center results in decreased pressure. Winds
flow clockwise around high-pressure centers in the
northern hemisphere.
Viewing a Marine Forecast or an Offshore Forecast
1
Select
Charts
>
Forecast
.
2
Pan the chart to an offshore location.
The Marine Forecast or Offshore Forecast options appear
when forecast information is available.
3
Select
Marine Forecast
or
Offshore Forecast
.
City Forecasts
City forecasts appear as weather symbols. The forecast is
viewed in 12-hour increments.
Symbol Weather
Symbol Weather
Partly cloudy
Fair (sunny, hot, clear)
Cloudy
Rain (drizzle, sleet, showers)
Windy
Foggy
Symbol Weather
Symbol Weather
Thunderstorms
Snow (snow showers, flurries,
blizzard, blowing snow, sleet,
freezing rain, freezing drizzle)
Smoke (dusty, hazy)
Viewing Sea Conditions
The Sea Conditions feature shows information about surface
conditions, including winds, wave height, wave period, and wave
direction.
Select
Charts
>
Sea Conditions
.
Surface Winds
Surface wind vectors appear on the Sea Conditions chart using
wind barbs that indicate the direction from which the wind is
blowing. A wind barb is a circle with a tail. The line or flag
attached to the tail of the wind barb indicates the wind speed. A
short line represents 5 knots, a long line represents 10 knots,
and triangle represents 50 knots.
Wind Barb
Wind Speed
Wind Barb
Wind Speed
Calm
20 knots
5 knots
50 knots
10 knots
65 knots
15 knots
Wave Height, Wave Period, and Wave Direction
Wave heights for an area appear as variations in color. Different
colors indicate different wave heights, as shown in the legend.
The wave period indicates the time (in seconds) between
successive waves. Wave period lines indicate areas that have
the same wave period.
Wave directions appear on the chart using red arrows. The
direction of each arrow pointer indicates the direction in which a
wave is moving.
Viewing Forecast Sea Conditions Information for
Another Time Period
1
Select
Charts
>
Sea Conditions
.
2
Select an option:
• To view forecasted sea conditions for the next 36 hours, in
12-hour increments, select
Next Forecast
multiple times.
• To view the forecasted sea conditions for the previous 36
hours, in 12-hour increments, select
Previous Forecast
multiple times.
Viewing Fishing Information
The weather Fishing chart shows present water temperature,
present surface pressure conditions, and fishing forecasts.
Select
Charts
>
Fishing
.
Surface Pressure and Water Temperature Data
Surface-pressure information appears as pressure isobars and
pressure centers. Isobars connect points of equal pressure.
Pressure readings can help to determine weather and wind
conditions. High-pressure areas are generally associated with
fair weather. Low-pressure areas are generally associated with
clouds and the chance of precipitation. Isobars packed closely
together show a strong pressure gradient. Strong pressure
gradients are associated with areas of stronger winds.
Pressure units are shown in millibars (mb), inches of Mercury
(inHg), or hectopascals (hPa).
Colored shading indicates the surface temperature of the water,
as shown in the legend in the corner of the display.
SiriusXM Weather
31
CONFIDENTIAL