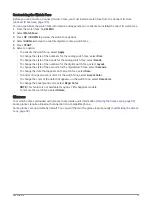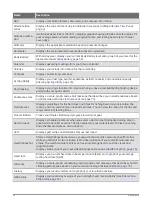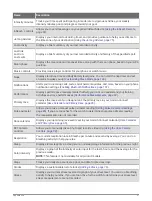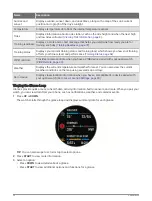
Name
Description
ABC
Displays combined altimeter, barometer, and compass information.
Alternate time
zones
Displays the current time of day in additional time zones (
).
Altitude acclima
tion
At altitudes above 800 m (2625 ft.), displays graphs showing altitude-corrected values for
your average pulse oximeter reading, respiration rate, and resting heart rate for the last
seven days.
Altimeter
Displays the approximate elevation based on pressure changes.
Barometer
Displays the environmental pressure data based on elevation.
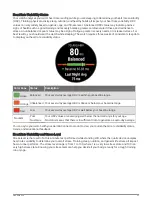
Body Battery
™
With all-day wear, displays your current Body Battery level and a graph of your level for the
last several hours (
).
Calendar
Displays upcoming meetings from your phone calendar.
Calories
Displays your calorie information for the current day.
Compass
Displays an electronic compass.
Cycling Ability
Displays your rider type, aerobic endurance, aerobic capacity, and anaerobic capacity
(
Viewing Cycling Ability, page 74
).
Dog tracking
Displays your dog's location information when you have a compatible dog tracking device
paired with your quatix watch.
Endurance score
Displays a score, graph, and a short message that describes your overall endurance based
on all recorded activities (
).
Fish forecast
Displays predictions for the best days and times for fishing based on your location, the
moon's position, and the moon rise and set times. You can view the rating for the day and
major and minor feeding times.
Floors climbed
Tracks your floors climbed and progress toward your goal.
Garmin coach
Displays scheduled workouts when you select a Garmin coach adaptive training plan in
your Garmin Connect account. The plan adjusts to your current level of fitness, coaching
and schedule preferences, and race date.
Golf
Displays golf scores and statistics for your last round.
Health Snapshot
Starts a Health Snapshot session on your watch that records several key health metrics
while you hold still for two minutes. It provides a glimpse of your overall cardiovascular
status. The watch records metrics such as your average heart rate, stress level, and
respiration rate.
Displays summaries of your saved Health Snapshot sessions (
).
Heart rate
Displays your current heart rate in beats per minute (bpm) and a graph of your average
resting heart rate (RHR).
Hill score
Displays a score, graph, contributing metrics, and a short message that describes your hill
climbing performance based on your recorded running activities (
).
History
Displays your activity history and a graph of your recorded activities.
HRV Status
Displays your seven-day average of your overnight heart rate variability (
).
56
Appearance

