RELAY TESTING
8-3
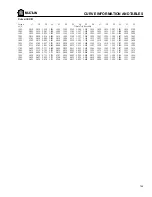
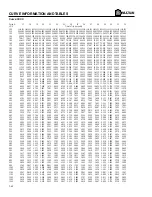
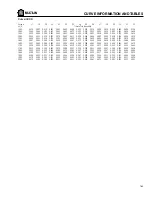
LED is illuminated. Select the curve in use from Appendix D
and read the time to trip for the chosen current. Verify that the
measured time corresponds to the time indicated for this
current by the curve, within the accuracy given in the speci-
fications, Section 9 of this manual. This test can be repeated
for other currents, as a further check.
Ground Current Input Function Check
This test determines if the 565/575 Relay is reading the
correct ground current values. Using the test set of Figure
8.1, apply control power and put the relay into the setpoints
mode. Use the LINE DOWN key to view message S 3.5 and
adjust the ground overcurrent pickup level to 40% of the CT
rating.
Check the setpoints message S 3.2 to verify that the ground
sensing is enabled. If not, select and store ENABLED for this
setpoint. Press the LINE DOWN key and read the sensing
system selected from message S 3.3. If zero sequence
sensing has been selected, view message S 3.4 to deter-
mine the primary CT rating. If residual sensing has been
selected in message S 3.3, determine the phase current CT
rating, as described in the phase current input function
check. Using a CT ratio of 100/5 as an example, the dis-
played current can be calculated as follows:
Displayed current = Injected current × CT Primary Rating ÷
CT Secondary Rating.
Use the test set current adjustment to set the injected ground
current, read from the ammeter, to a convenient value, for
example, 1.5 Amps, if a 5 Amp CT is being used. The display
should read:
Displayed current = 1.5 × 100/5 or 30 Amps.
If a CT ratio other than this is used, it should be entered in the
above equation.
Read the displayed value of ground current from actual
values Page 1, message A 1.5 and verify that it agrees with
the calculated value.
Ground Instantaneous Pickup and Trip
Check
Ground overcurrent conditions may be detected by either
residual current sensing or zero sequence sensing. The test
setup shown in Figure 8.1 may be used in either case.
Ground protection is tested by injecting a current at terminals
55 and 56 of the 565/575 Relay to simulate ground overcur-
rent conditions.
First view message S 3.2 to verify that ground sensing is
enabled. If not, enable it. Use the LINE DOWN key to view the
CT rating for zero sequence current, or refer to phase CT
ratio for residual currents. Make a note of this value.
Use the LINE DOWN key to view setpoints message S 3.5
and verify that the ground overcurrent pickup is set at 12%. If
not, enter and store this value. View message S 3.13 and
check that the ground instantaneous trips are enabled. If not,
select and store ENABLED in this message. View message S
3.14, and enter the chosen value for the ground instantane-
ous trip level, as a multiple of the overcurrent pickup level, for
example, 3.
View message S 3.15, ground instantaneous delay. Select 0
for this value to set the delay off. Press the STORE key to
store the setpoint and verify that the message displays INST.
Read message S 3.16 to check which relay the ground trip
has been assigned. The factory setpoint will be the trip relay.
In this example, the pickup level is 12% of 5 Amps (the CT
ratio or CT rating depending on which sensing system is
chosen) or 0.6 Amps. The trip level was chosen to be 3 times
this pickup level or 1.8 Amps. Using the test setup current
adjustment, slowly increase the current injected until the
ammeter reads 1.8 Amps. Verify that the trip relay, or which-
ever relay to which the signal was assigned, is activated and
the corresponding LED is illuminated.
Check that the actual values section gives ground instanta-
neous overcurrent as the cause of last trip. Using the test set
current adjustment, decrease the injected current slowly and
check that the trip or other assigned relay can be reset at
95% of the pickup setting.
Ground Curve Verification
With the above settings unchanged, view message S 3.6,
which gives the ground protection curve in use. Record which
curve has been selected. Use LINE DOWN to view setpoints
message S 3.7 which is the ground overcurrent curve number.
Enter and store a value of 1 for this.
Enter the actual values mode, and use LINE DOWN to view
message A 1.5 which displays ground current. Using the test
setup, slowly increase the injected current until the ammeter
indicates a convenient value higher than the pickup value.
Two times the pickup level is chosen here so if the CT rating
is 5 Amps and 12% is chosen as the pickup level, then the
injected current should be set at two times 12% of 5 (0.6) or
1.2 Amps.
Without changing the current setting, press the start button
on the test set. This will activate the timer until the trip or
other assigned relay is activated. When the assigned ground
relay is activated and the corresponding LED illuminates,
check the time indicated on the test set timer. Refer to the
ground curve in use in Appendix D of this manual. Verify that
the measured time corresponds to the curve time, within the
accuracy stated in the specifications in Section 9 of this
manual.
Repeat the test for other values of ground current and verify
that the trip time corresponds to the time on the curve as
Summary of Contents for 565
Page 6: ...INSTALLATION 2 2 Figure 2 1 Mounting Details ...
Page 7: ...INSTALLATION 2 3 Figure 2 2 Mounting Arrangement with Relay Collar ...
Page 12: ...INSTALLATION 2 8 Figure 2 5 565 Relay Typical Wiring ...
Page 13: ...INSTALLATION 2 9 Figure 2 6 Voltage Sensing Wire ...
Page 14: ...INSTALLATION 2 10 Figure 2 7A 565 with MTM CT and Open Delta VT Typical Wiring ...
Page 15: ...INSTALLATION 2 11 Figure 2 7B 565 with MTM CT and Wye VT Typical Wiring ...
Page 16: ...INSTALLATION 2 12 Figure 2 8A Open Delta VT and CT MTM Typical Wiring ...
Page 17: ...INSTALLATION 2 13 Figure 2 8B Wye VT and CT MTM Typical Wiring ...
Page 18: ...INSTALLATION 2 14 Figure 2 9 MTM Mounting Dimensions ...
Page 19: ...INSTALLATION 2 15 Figure 2 10 565 Rear Panel Layout ...
Page 20: ......
Page 23: ...DISPLAY AND KEYBOARD 3 3 Figure 4 1 565 Relay Front Panel ...
Page 28: ......
Page 132: ......
Page 142: ...CURVE INFORMATION ANDTABLES 7 10 Figure 7 9 IEC A Curves ...
Page 143: ...CURVE INFORMATION ANDTABLES 7 11 Figure 7 10 IEC B Curves ...
Page 144: ...CURVE INFORMATION ANDTABLES 7 12 Figure 7 11 IEC C Curves ...
Page 176: ...RELAYTESTING 8 2 Figure 8 1 Secondary Injection Test Setup ...
Page 180: ......
Page 184: ......
Page 192: ...APPENDIX C C 2 Figure C1 System Controller Block Diagram 1 2 ...
Page 193: ...APPENDIX C C 3 Figure C2 System Controller Block Diagram 2 2 ...
Page 194: ......
Page 198: ......


