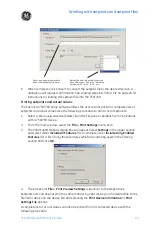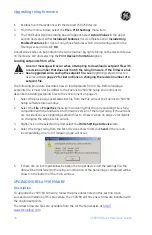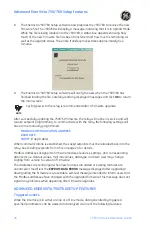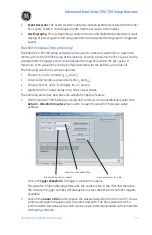
Advanced EnerVista 750/760 Setup features
30
750/760 Quick Reference Guide
9.
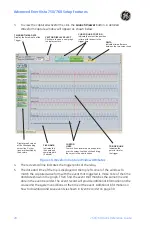
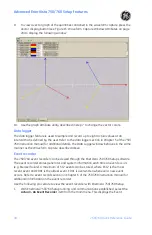
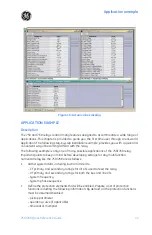
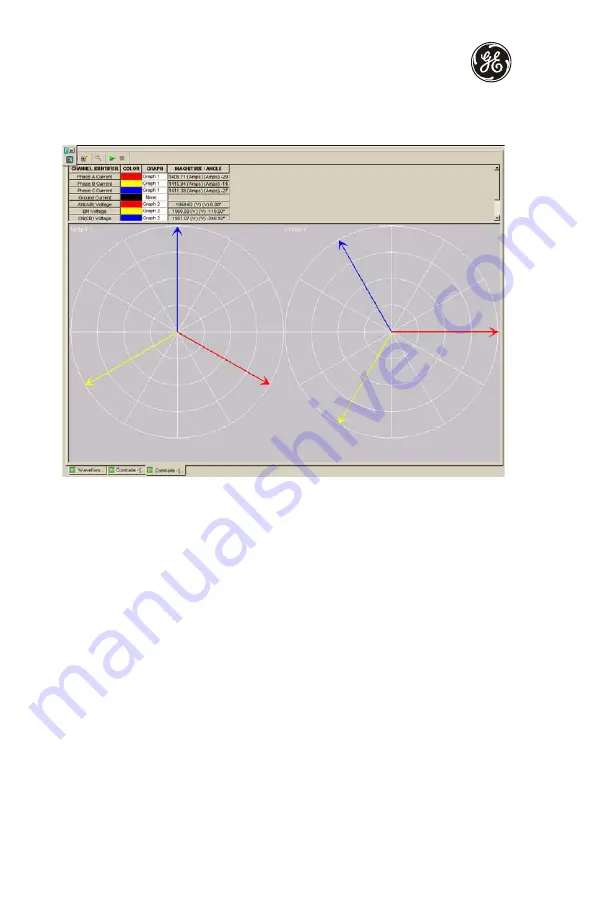
To view a vector graph of the quantities contained in the waveform capture, press the
Vector display button (see Figure 15: Waveform Capture Window Attributes on page
28) to display the following window:
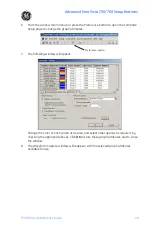
10. Use the graph attribute utility described in step 7 to change the vector colors.
Data logger
The data logger feature is used to sample and record up to eight actual values at an
interval that is defined by the user. Refer to the data logger section in Chapter 5 of the 750/
760 instruction manual for additional details. The Data Logger window behaves in the same
manner as the Waveform Capture described above.
Event recorder
The 750/760 event recorder can be viewed through the EnerVista 750/760 Setup software.
The event recorder stores generator and system information each time an event occurs
(e.g. breaker failure). A maximum of 512 events can be stored, where E512 is the most
recent event and E001 is the oldest event. E001 is overwritten whenever a new event
occurs. Refer to event records section in Chapter 6 of the 750/760 instruction manual for
additional information on the event recorder.
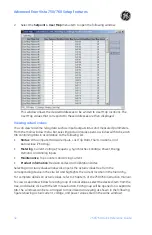
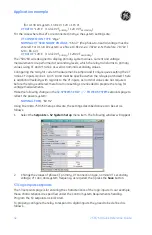
Use the following procedure to view the event recorder with EnerVista 750/760 Setup:
1.
With EnerVista 750/760 Setup running and communications established, select the
Actual > A4 Event Recorder
item from the main menu. This displays the Event
Summary of Contents for 750
Page 2: ......
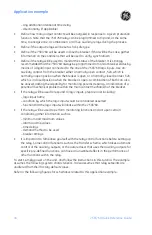
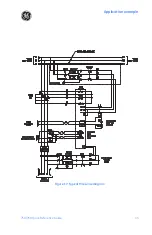
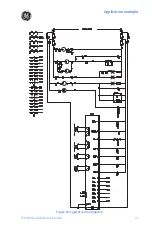
Page 39: ...Application example 750 760 Quick Reference Guide 35 Figure 17 Typical three line diagram...
Page 41: ...Application example 750 760 Quick Reference Guide 37 Figure 19 Typical control diagram...
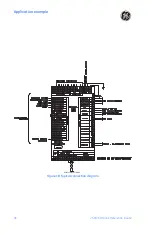
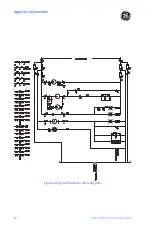
Page 42: ...Application example 38 750 760 Quick Reference Guide Figure 20 Typical breaker control diagram...
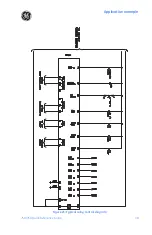
Page 43: ...Application example 750 760 Quick Reference Guide 39 Figure 21 Typical relay control diagram...

