CB Watch 3 User Manual
v6.3 - May 2019
Page 43 of 100
•
The
“
short-term
”
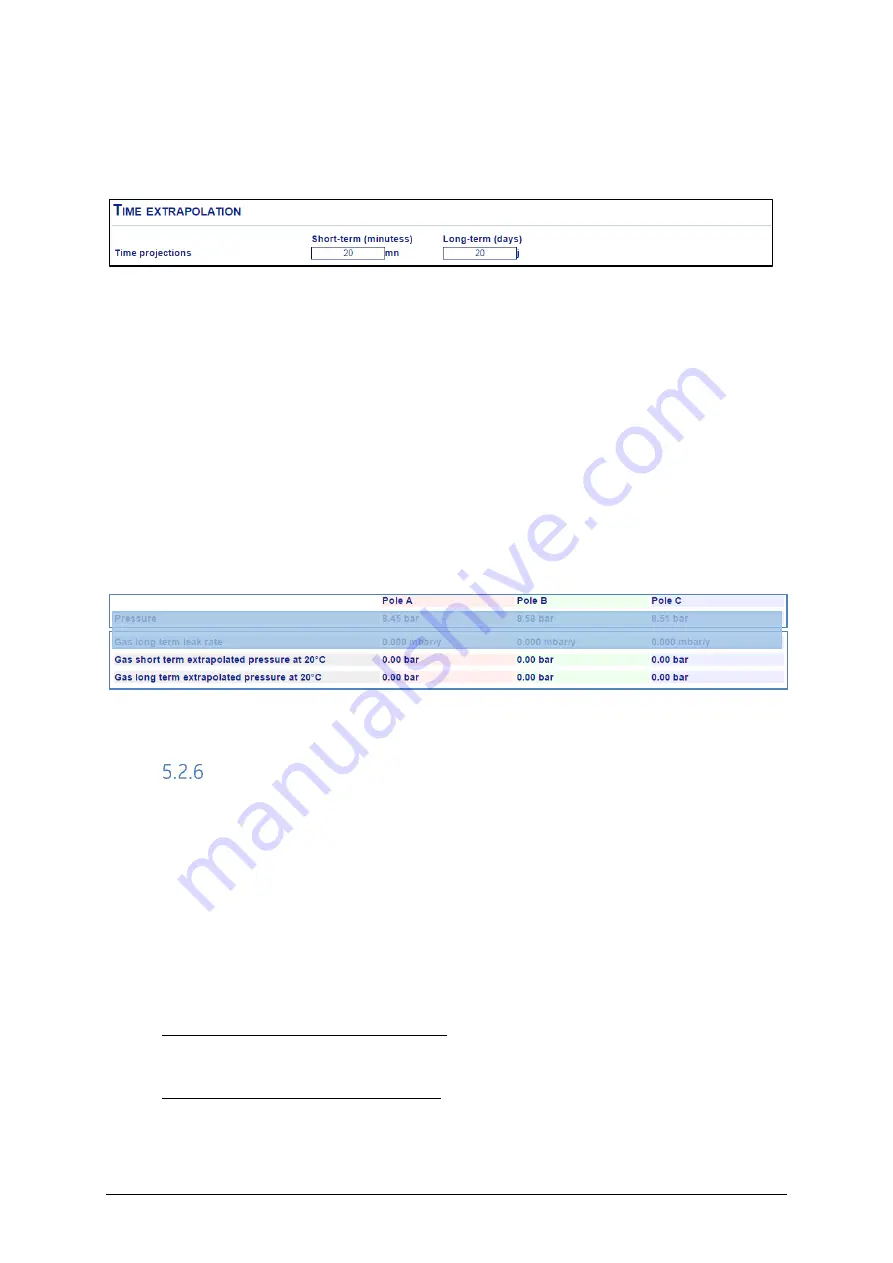
time horizon can be set from 20 min to 1,200 minutes (20 hours)
•
The
“
long-term
”
time horizon can be set from 20 days to 200 days
HMI: Settings/Gas monitoring
Figure 59
–
Time horizons setup
For
“
long-term
”
gas pressure trend calculations, the equivalent gas pressure at 20°C is
recorded every night at 2AM . This allows for consistent conditions and the removal of
external influences such as variations in line load or solar radiation.
For the
“
short-term
”
trend, the recordings are taken much more frequently and will show
greater sensitivity to external influences. It is therefore much more difficult to calculate
an accurate leakage rate by using a standard calculation.
When 3 independent gas volumes are monitored, by assuming that the leak will appear
on only one volume, a reliable detection of relatively rapid leaks is carried out by
comparing the measured extrapolated pressures of the three volumes taken two by two.
HMI: Measurements/Gas
Figure 60
–
Forecasted gas pressure values
Gas leak rates
Whenever there is a leak in the gas system, this manifests itself as a drop in the gas
pressure.
•
Short-term pressure leak rate: in pressure unit per hour
•
Long-term pressure leak rate: in pressure unit per year
It is possible to visualise the following gas information in the HMI either for one of three
separate tanks depending on the number of sensors installed.
The leak rates calculated using the long-term horizon values are the most accurate.
The calculations use the following principles:
The short-term gas pressure leak rate = change in pressure at 20
o
C calculated
using the values in the short-term stack, scaled to an hour (in pressure unit per
hour)
The long-term gas pressure leak rate = change in pressure at 20
o
C calculated
using the values in the long-term stack, scaled to a year (in pressure unit per year)


